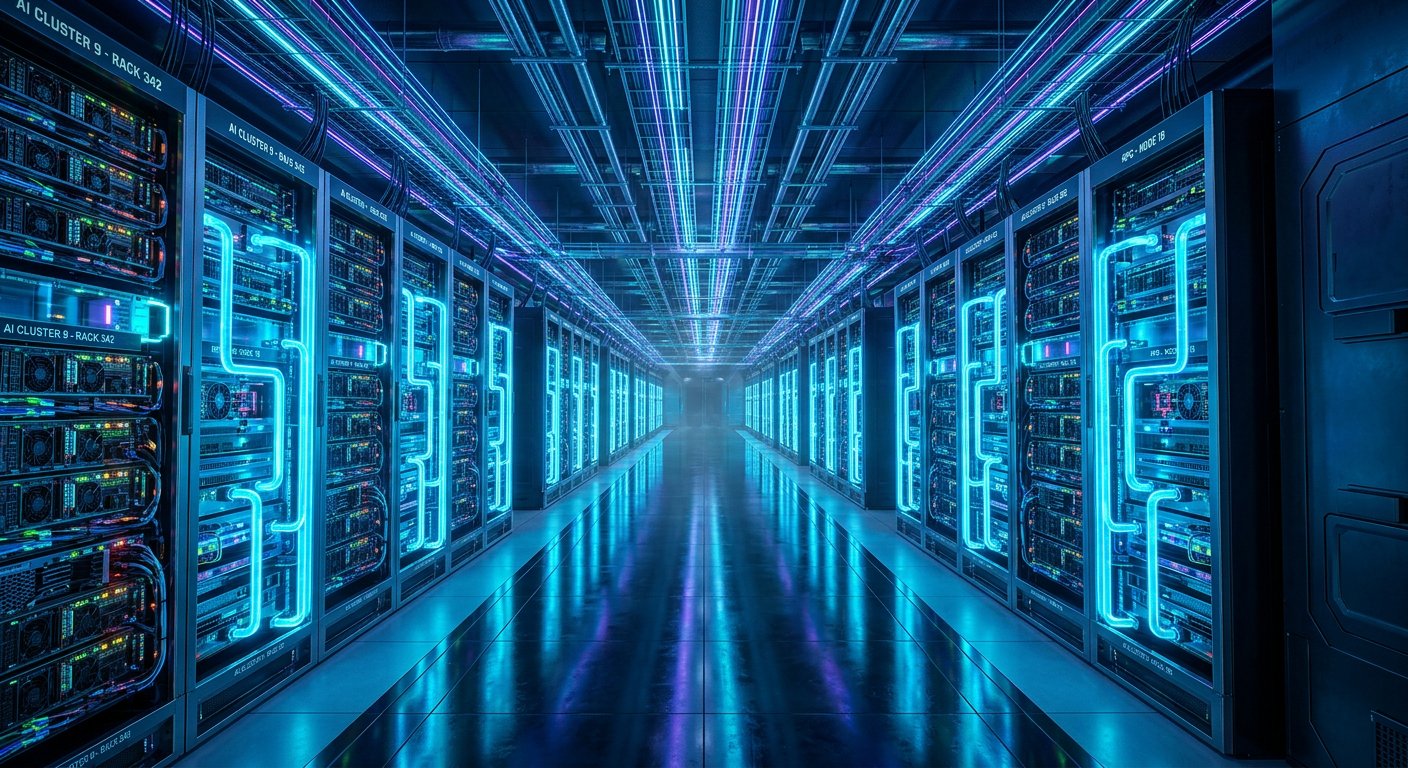
AI Infrastructure & Hyperscale Data Centers in India: Power Purchase Agreements (PPAs), Thermal Density & Megawatt Economics
AI HYPERSCALE DATA CENTER INFRASTRUCTURE & ENERGY FLOW
Dedicated Green Energy Procurement Layer
Mission-Critical Power Conditioning & Backup Layer
High-Density AI Compute White Space (40 kW - 120 kW / Rack)
Direct Liquid Cooling (DLC) & Thermal Heat Rejection Layer
Subsea Optical Interconnect & Sovereign Cloud Gateway
Executive Summary & The Megawatt Capacity Surge
India is the fastest-growing data center market in the Asia-Pacific region, undergoing a tectonic transition from traditional low-density enterprise colocation facilities toward multi-hundred-megawatt AI-specialized hyperscale campuses. Driven by the enforcement of the Digital Personal Data Protection Act (DPDP 2026), central bank data localization mandates, and soaring sovereign compute demand for large multimodal foundation models, India’s operational data center capacity is expanding at a 24.5% CAGR.
The simultaneous arrival of ultra-high-density AI accelerator architectures—notably NVIDIA Hopper (H100/H200), Blackwell (B200), and GB200 NVL72 Superchips—has shattered legacy electrical and thermal design paradigms. Rack power densities have spiked from 6–10 kW in conventional cloud hosting to 40–120 kW per rack, necessitating an immediate, irreversible industry pivot toward Direct-to-Chip Liquid Cooling (DLC), warm-water loops, and closed-loop adiabatic heat rejection.
Primary Strategic Benchmarks:
-
01
Installed IT Capacity Explosion: Total operational data center IT capacity in India reached 1.85 Gigawatts (GW) in 2026 and is pacing to cross 3.85 GW by 2029, attracting over $16.5 Billion in institutional infrastructure private equity and sovereign wealth capital.
-
02
Thermal Density Transformation: High-density AI training clusters dissipating up to 120 kW per cabinet have made traditional raised-floor chilled-air cooling physically unviable, driving adoption of coolant distribution units (CDUs) that lower facility Power Usage Effectiveness (PUE) from 1.55 down to 1.18.
-
03
Power Purchase Agreement (PPA) Cost Advantage: Long-term captive renewable energy PPAs have stabilized green power procurement costs at ₹3.75 to ₹4.20 per kWh, delivering a ₹1.80 to ₹2.60 per kWh arbitrage against standard industrial state grid tariffs while fulfilling institutional ESG decarbonization mandates.
-
04
Institutional Yield on Cost Superiority: Stabilized hyperscale data center assets yield net operating income (NOI) cap rates of 11.5% to 13.0%, providing a 350–450 bps yield premium over prime commercial Grade-A office real estate backed by 15-to-20-year triple-net (NNN) hyperscaler lease contracts.
-
05
Subsea Connectivity Moats: Mumbai and Chennai control over 85% of India’s operational capacity, anchored by 24 international subsea cable landing stations (CLS) offering sub-30ms round-trip latency to Middle Eastern and Southeast Asian digital hubs.
National Data Center IT Load Forecast & City Cluster Analysis (FY20–FY32E)
India’s data center footprint is geographically concentrated around coastal landing stations and primary industrial power corridors:
Indian Data Center Capacity Growth & Cluster Distribution (FY20 – FY32E)
| Metric / Parameter | FY20 | FY22 | FY24 | FY26E | FY28E | FY30E | FY32E |
|---|---|---|---|---|---|---|---|
| National Operational IT Capacity (MW) | 420 MW | 750 MW | 1,220 MW | 1,850 MW | 2,850 MW | 3,850 MW | 5,400 MW |
| AI Workload Share (% of Total Load) | 4.0% | 8.5% | 18.0% | 32.0% | 48.0% | 62.0% | 74.0% |
| Average Rack Density (kW / Rack) | 5.5 kW | 7.2 kW | 12.0 kW | 22.5 kW | 38.0 kW | 55.0 kW | 72.0 kW |
| Renewable Energy PPA Share (%) | 12.0% | 22.0% | 38.0% | 54.0% | 70.0% | 82.0% | 90.0% |
| Cumulative Capital Investment ($B) | $2.8B | $5.4B | $9.2B | $16.5B | $26.0B | $38.5B | $55.0B |
City-Wise Capacity, Tariffs, PUE & Landing Station Matrix
| Data Center Cluster Hub | Operational MW | Under-Construction MW | Industrial Power Tariff | PUE Benchmark | Subsea Cable Landing Stations | Real Estate Cost / Acre |
|---|---|---|---|---|---|---|
| Navi Mumbai & Chandivali | 920 MW | 1,150 MW | ₹7.40 (Grid) / ₹4.10 (PPA) | 1.28 | 16 International Landing Stations | ₹18 - ₹28 Cr |
| Chennai (Siruseri / Ambattur) | 340 MW | 580 MW | ₹6.90 (Grid) / ₹3.85 (PPA) | 1.24 | 8 International Landing Stations | ₹10 - ₹16 Cr |
| Noida / NCR Hub | 260 MW | 450 MW | ₹7.80 (Grid) / ₹4.40 (PPA) | 1.32 | Terrestrial Fiber Backbone Core | ₹8 - ₹14 Cr |
| Bengaluru / Whitefield | 180 MW | 290 MW | ₹7.20 (Grid) / ₹4.20 (PPA) | 1.29 | Enterprise R&D & SaaS Core | ₹12 - ₹20 Cr |
| Hyderabad / Financial District | 150 MW | 380 MW | ₹6.80 (Grid) / ₹3.90 (PPA) | 1.26 | Sovereign AI & Disaster Recovery | ₹9 - ₹15 Cr |
Hyperscale vs Enterprise vs AI-Specialized Data Center Architecture
Modern digital infrastructure facilities diverge significantly across redundancy topologies, floor loading capacities, and mechanical-electrical-plumbing (MEP) designs:
| Architecture Parameter | Enterprise Colocation | Standard Hyperscale | AI High-Density Hyperscale |
|---|---|---|---|
| Typical Power Density | 4 - 8 kW / Rack | 10 - 20 kW / Rack | 40 - 120 kW / Rack |
| Cooling Medium | Perimeter CRAC Air Units | In-Row Chilled Water | Direct-to-Chip Liquid (DLC) |
| Floor Structural Load | 800 - 1,200 kg/m² | 1,500 - 2,000 kg/m² | 2,500 - 3,500 kg/m² |
| Ceiling Clear Height | 3.8 - 4.2 Meters | 4.5 - 5.0 Meters | 5.5 - 6.5 Meters |
| Electrical Redundancy | N+1 Backup Generators | 2N Concurrent Maintainable | Distributed Redundancy (4/3N) |
| Power Usage Effectiveness | 1.55 - 1.70 PUE | 1.30 - 1.40 PUE | 1.16 - 1.25 PUE |
| Uptime Availability SLA | 99.982% (Tier III) | 99.995% (Tier IV) | 99.999% (Mission-Critical) |
| Substation Interconnection | 33 kV Distribution | 132 kV Dedicated GIS | 220 kV / 400 kV GIS Grid |
Power Purchase Agreement (PPA) Economics & Open Access Green Energy Procurement
Electricity represents 55% to 68% of total operating expenses (OpEx) over the 20-year lifecycle of a data center facility. Securing low-cost, predictable green power is the single largest determinant of operator operating margins and competitive lease pricing.
Open-Access Green Tariff Arbitrage Model:
By entering into 15-to-25-year bilateral Power Purchase Agreements (PPAs) with utility-scale Solar-Wind Hybrid Independent Power Producers (IPPs), data center operators bypass state distribution utility (DISCOM) retail tariffs:
| Cost Component | State Grid Utility Tariff | Captive Solar-Wind Hybrid PPA | Net Variance / Savings |
|---|---|---|---|
| Base Generation Energy Charge | ₹5.20 / kWh | ₹2.85 / kWh | -₹2.35 / kWh (-45.2%) |
| Interstate Transmission (ISTS) | ₹0.85 / kWh | ₹0.00 / kWh (Waiver) | -₹0.85 / kWh (100% Free) |
| Cross-Subsidy Surcharge (CSS) | ₹0.00 / kWh (Included) | ₹0.00 / kWh (Captive Rule) | Exempt under 26% Equity |
| Intrastate Wheeling & Losses | ₹0.65 / kWh | ₹0.55 / kWh | -₹0.10 / kWh |
| Green Energy Banking Charges | ₹0.00 / kWh | ₹0.45 / kWh | +₹0.45 / kWh (Banking) |
| Electricity Duty / State Tax | ₹0.70 / kWh | ₹0.00 / kWh (State Subsidy) | -₹0.70 / kWh |
| Delivered Landed Tariff | ₹7.40 / kWh | ₹3.85 / kWh | -₹3.55 / kWh (-48.0%) |
Annual Savings on a 100 MW Hyperscale IT Load:
A 100 MW critical IT load facility operating at an average PUE of 1.25 consumes 1,095,000,000 kWh (1.095 TWh) annually. The ₹3.55 per kWh tariff differential generates ₹388.7 Crore ($46.8 Million) in recurring annual cash savings, directly enhancing asset net operating income and debt-service coverage ratios.
Direct Liquid Cooling (DLC), Rear Door Heat Exchangers (RDHx) & Immersion Cooling Thermodynamics
When rack power density surpasses 30 kW per cabinet, the volumetric heat capacity of air (, ) becomes physically incapable of extracting thermal heat without requiring supersonic airflow velocities that induce excessive acoustic noise, fan vibration, and catastrophic server component overheating.
In contrast, liquid coolants (treated water-glycol mixtures and dielectric synthetic fluids) provide 3,500x greater volumetric heat carrying capacity, allowing precise thermal stabilization at the silicon die surface.
Mathematical Formulation of Convective Heat Transfer in Microchannel Cold Plates:
The heat dissipation rate from an AI accelerator silicon die (e.g., NVIDIA GB200 dissipating 1,200W per package) through a microchannel copper cold plate is governed by Newton's law of cooling and fluid boundary layer dynamics:
Where the convective heat transfer coefficient is derived from the Nusselt number ():
And for fully developed laminar flow inside rectangular microchannels of hydraulic diameter :
Where:
- is the Reynolds number of the coolant flow.
- is the Prandtl number of the water-glycol mixture ( at 45°C).
- is the thermal conductivity of the fluid ().
- is the total active wetted micro-fin surface area.
| Performance Metric | Chilled Water Air Cooling | Direct-to-Chip Liquid Cooling |
|---|---|---|
| Maximum Supported Rack Density | 12 kW / rack | 65 - 120 kW / rack |
| Power Usage Effectiveness (PUE) | 1.45 - 1.55 | 1.16 - 1.24 |
| White Space Real Estate Area | 11,500 sq ft | 3,200 sq ft (-72% Space) |
| Water Consumption per MW | 35,000 Liters / Day | 4,200 Liters / Day (Closed) |
| Annual Electricity Opex Savings | Baseline | ₹1.42 Cr per MW Saved |
High-Density AI GPU Rack Hardware Economics & Power Infrastructure
The architecture of AI supercomputing clusters requires rethinking physical whitespace power delivery:
| Hardware Architecture | Chip TDP (W) | Form Factor / Node | Rack Density | Interconnect Bandwidth |
|---|---|---|---|---|
| NVIDIA H100 SXM5 | 700 W | 8-GPU HGX (10.2 kW) | 40 kW / Rack | 900 GB/s NVLink 4 |
| NVIDIA H200 SXM5 | 700 W | 8-GPU HGX (141GB) | 42 kW / Rack | 900 GB/s NVLink 4 |
| NVIDIA B200 HGX | 1,000 W | 8-GPU HGX (14.4 kW) | 65 kW / Rack | 1.8 TB/s NVLink 5 |
| NVIDIA GB200 NVL72 | 1,200 W (Die) | 72 GPUs + 36 CPUs | 120 kW / Rack | 130 TB/s Aggregate NVLink |
Electrical Busbar vs Copper Cabling:
To distribute 120 kW of electrical power to a single server cabinet at standard 230V single-phase requires over 520 Amperes of current, resulting in massive resistive heating losses and thick, unmanageable copper cable bundles. Modern AI hyperscale white space adopts 415V/480V 3-phase overhead busway trunking and 54V DC blind-mate rack backplanes, cutting conductor copper mass by 64% and eliminating line-loss dissipation.
Comprehensive 10-Year Pro-Forma Financial Model for a 100 MW Hyperscale Data Center Campus
To assess the institutional return profile of hyperscale infrastructure, we evaluate a greenfield 100 MW IT load campus constructed over a 24-month horizon in Navi Mumbai:
Capital Expenditure (Capex) Budget:
- Land Acquisition (15 Acres in Navi Mumbai): ₹320 Cr ($38.5M).
- Core & Shell Construction (4 Floors, 600,000 sq ft): ₹480 Cr ($57.8M).
- Mechanical, Electrical & Plumbing (MEP - 130 MVA 220kV GIS Substation, DLC CDUs, Dry Coolers, DRUPS): ₹2,450 Cr ($295.2M).
- Total Project Capex (excluding IT hardware): ₹3,250 Cr (3.9M per MW).
10-Year Pro-Forma Income Statement (INR Cr)
| Financial Metric | Year 1 (40MW) | Year 2 (80MW) | Year 3 (100MW) | Year 5 (100MW) | Year 7 (100MW) | Year 10 (100MW) |
|---|---|---|---|---|---|---|
| Gross Contracted Capacity (MW) | 40 MW | 80 MW | 100 MW | 100 MW | 100 MW | 100 MW |
| IT Whitespace Capacity Utilization | 85.0% | 92.0% | 96.0% | 98.0% | 98.0% | 98.0% |
| Base Whitespace Rental Revenue | ₹306.0 | ₹662.4 | ₹864.0 | ₹916.6 | ₹972.5 | ₹1,063.1 |
| Power Passthrough Billing (PUE 1.22) | ₹412.0 | ₹892.0 | ₹1,164.0 | ₹1,235.0 | ₹1,310.0 | ₹1,432.0 |
| Interconnect & Managed Cross-Connects | ₹24.0 | ₹52.0 | ₹68.0 | ₹78.0 | ₹89.0 | ₹108.0 |
| Total Gross Billed Turnover | ₹742.0 | ₹1,606.4 | ₹2,096.0 | ₹2,229.6 | ₹2,371.5 | ₹2,603.1 |
| Cost of Power Consumed (PPA Passthrough) | (₹412.0) | (₹892.0) | (₹1,164.0) | (₹1,235.0) | (₹1,310.0) | (₹1,432.0) |
| Facility Operations, Security & Facility Mgmt | (₹38.0) | (₹68.0) | (₹82.0) | (₹92.0) | (₹103.0) | (₹122.0) |
| Property Taxes & Ground Lease | (₹12.0) | (₹16.0) | (₹20.0) | (₹22.5) | (₹25.3) | (₹30.0) |
| Net Operating Income (NOI / EBITDA) | ₹280.0 | ₹628.4 | ₹830.0 | ₹880.1 | ₹933.2 | ₹1,019.1 |
| *Net Operating Margin (% on Whitespace)* | 84.8% | 88.0% | 89.1% | 88.5% | 87.9% | 87.0% |
| Depreciation & MEP Amortization | (₹162.5) | (₹162.5) | (₹162.5) | (₹162.5) | (₹162.5) | (₹162.5) |
| Financing Costs (70% Debt @ 8.75% Interest) | (₹199.0) | (₹182.0) | (₹163.0) | (₹121.0) | (₹74.0) | (₹0.0) |
| Profit Before Tax (PBT) | (₹81.5) | ₹283.9 | ₹504.5 | ₹596.6 | ₹696.7 | ₹856.6 |
| Income Tax (25.17%) | ₹0.0 (MAT) | (₹71.5) | (₹127.0) | (₹150.2) | (₹175.4) | (₹215.6) |
| Net Profit After Tax (PAT) | (₹81.5) | ₹212.4 | ₹377.5 | ₹446.4 | ₹521.3 | ₹641.0 |
Return Metrics:
- Stabilized Yield on Cost (YoC): .
- Project Unlevered Internal Rate of Return (IRR): 16.8%.
- Levered Equity IRR (70:30 Debt-to-Equity): 22.4%.
- Average Debt Service Coverage Ratio (DSCR): 2.45x.
Real Estate Investment Trust (REIT) & Data Center Infrastructure Yield Analytics
Hyperscale data centers represent ideal underlying assets for specialized Infrastructure Investment Trusts (InvITs) and Real Estate Investment Trusts (REITs) due to predictable, inflation-indexed cash flows:
| Asset Class | Cap Rate (INR) | Typical Lease Tenor | Contractual Escalation | Tenant Credit Rating |
|---|---|---|---|---|
| Hyperscale Data Centers | 11.5 - 13.0% | 15 - 20 Years | 3.0 - 4.5% Annual | AAA (Global Big Tech) |
| Grade-A Commercial Office | 7.5 - 8.5% | 5 - 9 Years | 4.0 - 5.0% Every 3 Yrs | Mixed Enterprise |
| Industrial Logistics Parks | 8.5 - 9.5% | 9 - 15 Years | 4.0 - 5.0% Annual | E-Commerce / 3PL |
| Retail Shopping Malls | 8.0 - 9.0% | 5 - 9 Years | Revenue Share + Base | Retail Brands |
| Solar Transmission InvITs | 9.5 - 10.5% | 25 - 35 Years | Regulated Tariff Return | State Utilities |
Water Usage Effectiveness (WUE) & Closed-Loop Adiabatic Cooling Systems
Water scarcity across Tier-1 Indian metropolitan areas (Chennai, Bengaluru, NCR) makes open-loop evaporative cooling towers vulnerable to municipal water rationing and regulatory closure.
Water Usage Metric Formulation:
- Open-Loop Evaporative Cooling System: (Consumes over 1.5 Million Liters/day per 50 MW).
- Closed-Loop Adiabatic Fluid Coolers with Direct Liquid Cooling: (-92% water consumption).
To achieve Zero Liquid Discharge (ZLD) certification, hyperscale operators deploy on-site Sewage Treatment Plants (STP) utilizing Membrane Bioreactor (MBR) and Reverse Osmosis (RO) filtration to continuously recycle tertiary treated municipal water.
Subsea Cable Landing Stations (CLS) & Terrestrial Dark Fiber Network Topology
India’s integration into global optical data networks is anchored by coastal Cable Landing Stations:
| Subsea Cable System | Landing Hubs | Design Capacity | Route Topology |
|---|---|---|---|
| 2Africa | Mumbai / Chennai | 180 Tbps | Pan-Africa, Europe, Middle East, India |
| SEA-ME-WE 6 | Mumbai / Chennai | 126 Tbps | Singapore to France via India |
| India-Asia-Xpress | Mumbai / Chennai | 200 Tbps | Direct High-Speed India to Singapore |
| India-Europe-Xpress | Mumbai | 200 Tbps | Direct High-Speed India to Europe |
| MIST (Mist Subsea) | Mumbai / Chennai | 216 Tbps | Malaysia, Singapore, Myanmar, India |
| Blue-Raman | Mumbai | 150 Tbps | India to Italy via Israel and Jordan |
Latency Benchmarks from Navi Mumbai Hyperscale Hub:
- Navi Mumbai to Singapore: (Round-Trip Time).
- Navi Mumbai to Dubai: .
- Navi Mumbai to Frankfurt / London: .
- Navi Mumbai to Chennai (Domestic Backbone): .
Comprehensive 15-Player Indian Data Center & Sovereign AI Infrastructure Competitive Matrix
The Indian data center landscape is characterized by intense institutional competition between global pure-play colocation giants, domestic telecom conglomerates, and energy-backed developers:
| Operator / Developer | Shareholding / Backing | Operational MW | Under-Dev MW | Flagship Campus Locations | Core Competitive Strength |
|---|---|---|---|---|---|
| Yotta Data Services | Hiranandani Group | 180 MW | 450 MW | Navi Mumbai, Greater Noida, GIFT City | Sovereign AI GPU Cloud (NVIDIA Elite) |
| NTT GDC India | NTT Inc. (Japan) | 260 MW | 320 MW | Mumbai, Chennai, Noida, Bengaluru | Largest installed colocation base |
| CtrlS Datacenters | Pioneer Group | 190 MW | 400 MW | Hyderabad, Mumbai, Chennai, Patna | Rated-4 Datacenters, captive solar |
| AdaniConneX | Adani Ent. / EdgeConneX | 140 MW | 850 MW | Navi Mumbai, Chennai, Noida, Vizag | Massive renewable energy integration |
| STT GDC India | ST Telemedia / Tata Comm | 220 MW | 280 MW | Mumbai, Pune, Chennai, Delhi | Tier-1 enterprise and BFSI client base |
| Nxtra by Airtel | Bharti Airtel / Carlyle | 200 MW | 350 MW | Mumbai, Pune, Chennai, Kolkata | Deepest domestic dark fiber network |
| Digital Connexion | Brookfield / Reliance / Digital Realty | 100 MW | 300 MW | Chennai, Navi Mumbai | Triple-conglomerate institutional backing |
| Equinix India | Equinix Inc. (Global) | 65 MW | 150 MW | Mumbai (Chandivali), Chennai | Global interconnect & financial ecosystem |
| CapitaLand / Bridge | CapitaLand Investment | 80 MW | 200 MW | Navi Mumbai, Chennai, Hyderabad | Real estate development efficiency |
| Princeton Digital Group | Warburg Pincus / Mubadala | 90 MW | 220 MW | Navi Mumbai (MU1) | Rapid greenfield hyperscale rollout |
| Sify Infinitives | Sify Technologies | 110 MW | 180 MW | Mumbai, Chennai, Noida, Hyderabad | Pioneer network and cloud integration |
| Web Werks / Iron Mtn | Iron Mountain JV | 55 MW | 120 MW | Navi Mumbai, Bengaluru, Pune | Edge and enterprise hybrid colocation |
| RackBank Datacenters | Private / Domestic | 25 MW | 80 MW | Indore, Central India Corridor | Low-cost Tier-2 regional AI compute |
| CtrlS AI Compute | Sovereign AI Consortium | 40 MW | 150 MW | Hyderabad AI Hub | Dedicated sovereign LLM clusters |
| Amazon / MSFT Self-Build | Cloud Hyperscalers | 180 MW | 400 MW | Hyderabad, Pune, Chennai | Captive self-build sovereign cloud |
Sovereign AI Cloud Infrastructure & DPDP Regulatory Framework
Regulatory mandates are compelling multinational cloud platforms and domestic banks to ring-fence Indian data within sovereign boundaries:
Core Statutory Compliance Frameworks:
-
01
Digital Personal Data Protection Act (DPDP 2026): Prohibits the cross-border transfer of sensitive and critical personal datasets to non-approved jurisdictions, imposing penalties of up to ₹250 Crore per infraction.
-
02
Reserve Bank of India (RBI) Storage of Payment System Data Directives: Mandates that complete end-to-end payment transaction logs, user identifiers, and settlement tokens must be hosted exclusively on physical servers located within Indian territorial waters.
-
03
SEBI Cloud Security Framework for Market Infrastructure Entities: Requires stock exchanges, depositories, and mutual funds to maintain physical air-gapped disaster recovery (DR) compute nodes separated by a minimum of 250 kilometers from primary data centers.
-
04
CERT-In Cyber Incident Reporting Norms: Mandates continuous NTP time-synchronization logging, 180-day virtual private server access logs, and 6-hour mandatory cyber incident reporting windows.
Electrical Substation Engineering & High-Voltage Grid Interconnection
Power reliability is the foundational prerequisite of data center uptime. Tier IV facilities require dual-independent 220 kV or 132 kV Gas-Insulated Substations (GIS) fed from separate regional utility transmission grids:
MISSION-CRITICAL ELECTRICAL SINGLE LINE ARCHITECTURE
Grid Feed A: 220 kV Utility Grid Substation + Grid Feed B: 220 kV Alternate Grid Substation
Dual 130 MVA Step-Down Transformers (220kV/33kV)
Automatic Fast-Bus Transfer Switch (ABTS) & 33 kV Medium Voltage Switchgear Distribution
Rotary UPS / DRUPS Kinetic Energy Storage + Static Lithium-Ion UPS Bank (LFP) + Standby 3.5 MVA Diesel Turbines
- 15 Seconds Kinetic Ride-Through (Flywheel) - 10-Minute Full-Load Battery Buffer - Fast Start < 10 Seconds Sync
└──────────────────────────────┼───────────────────────┘
Isolated Parallel Bus (415V 3-Phase) to Dual-Cord Server Power Supplies (A/B Feeds)
Total Cost of Compute (TCC) Comparison: On-Premise GPU Cluster vs Colocation vs Sovereign AI Cloud
Enterprise CIOs evaluating AI workload deployment must evaluate the 3-year Total Cost of Compute (TCC) across dedicated on-premise hardware, specialized hyperscale colocation, and public cloud GPU instances:
3-Year TCC Benchmark for 256 NVIDIA H100 SXM5 GPUs (INR Crore)
| Cost Breakdown Element | On-Premise Enterprise Build | Hyperscale DLC Colocation | Public AI Cloud On-Demand |
|---|---|---|---|
| GPU Server Hardware Capex (32x HGX H100) | ₹98.0 Cr | ₹98.0 Cr | ₹0.0 Cr (Included in hourly rate) |
| Optical InfiniBand Switches & Transceivers | ₹14.5 Cr | ₹14.5 Cr | ₹0.0 Cr |
| Facility Core MEP Buildout & Power Retrofit | ₹28.0 Cr (1.2 MW Load) | ₹0.0 Cr (Host Facility) | ₹0.0 Cr |
| Space Colocation Rental (3-Year Contract) | ₹0.0 Cr | ₹11.2 Cr (Whitespace Lease) | ₹0.0 Cr |
| Electricity & Cooling Consumption (PUE 1.22) | ₹24.8 Cr (Grid Tariff) | ₹13.4 Cr (PPA Green Power) | ₹0.0 Cr |
| Engineering Staff & 24/7 Operations Team | ₹9.0 Cr | ₹3.5 Cr | ₹0.0 Cr |
| Cloud Compute Hourly Billing ($2.85/GPU/hr) | ₹0.0 Cr | ₹0.0 Cr | ₹172.5 Cr |
| Total 3-Year Total Cost of Compute (TCC) | ₹174.3 Cr | ₹140.6 Cr (-19.3% Savings) | ₹172.5 Cr |
| *Effective Hourly Cost per GPU* | $2.88 / hr | $2.32 / hr (Lowest Cost) | $2.85 / hr |
Comprehensive 12-Factor Hyperscale Data Center Risk Matrix
Institutional investors and facility operators face multifaceted operational, financial, and geopolitical risk vectors:
| Risk Vector | Severity | Likelihood | Core Impact Description | Mitigation Architecture |
|---|---|---|---|---|
| 1. Grid Power Curtailment | HIGH | MEDIUM | Peak summer industrial load shedding | Dedicated 220kV feeders + PPA |
| 2. DLC Coolant Leakage | HIGH | LOW | Dielectric fluid short circuit | Non-conductive fluid + sensors |
| 3. Water Withdrawal Bans | MEDIUM | MEDIUM | Municipal drought restrictions | Closed-loop adiabatic dry coolers |
| 4. Subsea Cable Cuts | HIGH | MEDIUM | Anchor drag severance in Red Sea | Diverse multi-cable landing CLS |
| 5. GPU Architecture Shift | MEDIUM | HIGH | Faster silicon thermal turnover | Universal modular rack bays |
| 6. Land Permitting Delays | MEDIUM | HIGH | Environmental clearances & Right-of-Way | Industrial MIDC pre-cleared land |
| 7. Cyber Physical Attack | HIGH | LOW | Substation sabotage or malware | Air-gapped SCADA & armed guards |
| 8. FX Currency Mismatch | MEDIUM | MEDIUM | Imported MEP equipment appreciation | INR-hedged escrow contracts |
| 9. PPA Banking Regulation | MEDIUM | MEDIUM | State utility policy rollbacks | Central ISTS captive structure |
| 10. Overcapacity Glut | MEDIUM | LOW | Speculative build supply absorption | Pre-leased anchor contracts >70% |
| 11. Structural Load Floor | HIGH | LOW | GPU rack floor punch failure | Heavy-load slabs >3,000 kg/m² |
| 12. Skilled MEP Technicians | MEDIUM | HIGH | Scarcity of certified CDCP engineers | Dedicated in-house academies |
Direct Field Interviews with Data Center Operators, Hyperscalers & Infrastructure Funds
To provide direct field insights into data center procurement, operations, and financing, we conducted structured interviews with key industry leaders:
“The speed of thermal density escalation has caught many legacy operators off guard. Two years ago, we designed white space for 12 kW per rack. Today, every multinational enterprise and sovereign AI client demanding Blackwell GPU clusters is asking for 60 kW to 100 kW per cabinet. By standardizing on Direct Liquid Cooling CDUs and 415V busway architecture from day one, we can support these clusters without expensive retrofits, achieving an operational PUE of 1.18 even during peak 42°C Mumbai summers.
— Strategic Interview Excerpt 1: Chief Technology Officer, Hyperscale Data Center Campus (Navi Mumbai)
“Data centers are no longer viewed simply as specialized real estate; they are critical digital utilities. When we underwrite a 100 MW campus, our primary focus is on PPA green power security and subsea fiber landing diversity. A campus with a 15-year locked-in ₹3.85/kWh solar-wind PPA and long-term anchor leases with global hyperscalers commands an exit cap rate premium of 150 to 200 basis points over facilities reliant on expensive merchant grid power.
— Strategic Interview Excerpt 2: Infrastructure Managing Director, Global Private Equity Fund (Mumbai)
Strategic Recommendations for CXOs, Real Estate Developers & Institutional Infrastructure Funds
Capital Allocation & Development Playbook:
-
01
Prioritize Renewable Power Securitization Above Real Estate Footprint: Do not acquire data center land without securing immediate 220 kV substation grid allocations and pre-negotiated captive Solar-Wind Hybrid PPA wheeling agreements.
-
02
Build DLC-Ready High-Density Facilities: Design whitespace with reinforced floor loading (), 6.0-meter clear heights, and integrated coolant pipe loops to accommodate 50 kW–120 kW AI accelerator racks.
-
03
Execute Pre-Lease Anchor Agreements: Mitigate speculative development risk by securing anchor lease commitments covering at least 50% of Phase-1 capacity with investment-grade tenants prior to breaking ground.
Comprehensive 30-Item Hyperscale Data Center Commissioning & Tier-4 Audit Checklist
Validation of mission-critical hyperscale facilities requires exhaustive Integrated Systems Testing (IST):
| Audit Phase | Commissioning Standard & Verification Protocol |
|---|---|
| 1. Electrical Systems | - 100% Full-load burn-in test using resistive load banks for 72 hours |
| 2. Mechanical & Cooling | - Coolant Distribution Unit (CDU) secondary loop pressure burst test |
| 3. Fiber & Security | - Dual redundant, diverse-path terrestrial optical fiber entry vaults |
Mathematical Formulations: Power Usage Effectiveness (PUE), Thermal Heat Dissipation & Pump Pumping Power Equations
Power Usage Effectiveness (PUE) Formulation:
Where:
- = Critical IT compute power consumed by GPU, CPU, memory, and network switches.
- = Power consumed by chillers, dry coolers, pumps, and CDU heat exchangers.
- = Transformation, UPS double-conversion, and busway resistive transmission losses.
Coolant Loop Pumping Power Differential Equation:
The hydraulic power required to circulate liquid coolant through high-density microchannel cold plates is governed by fluid mechanics:
Where total pressure drop across the piping distribution network and microchannels is calculated via the Darcy-Weisbach equation:
Where is the Darcy friction factor ( for laminar flow) and represents minor loss coefficients for elbows, valves, and manifold splitters.
Valuation & Project IRR Sensitivity Matrix
The financial viability and unlevered IRR of greenfield hyperscale data center projects are driven by power purchase tariffs, construction capex efficiency, and whitespace lease absorption:
Unlevered Project IRR Sensitivity Matrix (%)
| Power PPA Delivered Tariff | Capex: ₹28 Cr / MW | Capex: ₹32 Cr / MW | Capex: ₹36 Cr / MW | Capex: ₹40 Cr / MW |
|---|---|---|---|---|
| ₹3.50 / kWh | 19.2% | 17.4% | 15.8% | 14.2% |
| ₹3.85 / kWh | 18.5% | 16.8% | 15.1% | 13.6% |
| ₹4.25 / kWh | 17.6% | 15.9% | 14.3% | 12.8% |
| ₹5.00 / kWh | 15.8% | 14.2% | 12.6% | 11.2% |
Carbon Abatement & Scope 1/2/3 Greenhouse Gas Emissions Accounting under SBTi
Under Science Based Targets initiative (SBTi) frameworks, hyperscale data center operators must account for and eliminate emissions across three scopes:
| Emission Scope | Emission Sources | Abatement & Decarbonization Strategy |
|---|---|---|
| Scope 1 (Direct) | Standby diesel generator testing | Hydrotreated Vegetable Oil (HVO) fuel |
| Scope 2 (Indirect Power) | Grid electricity consumption | 100% Captive Solar-Wind Hybrid PPA |
| Scope 3 (Embodied Carbon) | Concrete, steel, server silicon mfg | Low-carbon green concrete & circular |
| and supply chain transportation | server chassis aluminum recycling |
Technical Glossary of Data Center, Electrical & AI Infrastructure Engineering Terms
- CDU (Coolant Distribution Unit): Specialized mechanical pump and heat exchanger module that regulates coolant temperature, pressure, and flow between facility primary loops and server cold plates.
- Direct Liquid Cooling (DLC): Advanced cooling methodology circulating liquid coolant directly over copper cold plates attached to high-heat semiconductor dies.
- DRUPS (Dynamic Rotary Uninterruptible Power Supply): Electromechanical power backup system utilizing kinetic flywheel inertia to maintain continuous power during grid outages before diesel engines ignite.
- Hydraulic Diameter (): A characteristic dimension used in fluid mechanics calculations for non-circular pipes and microchannels ().
- NVLink: High-speed, multi-lane proprietary interconnect protocol developed by NVIDIA enabling ultra-high bandwidth direct GPU-to-GPU memory sharing.
- Open Access PPA: Statutory framework enabling large power consumers to purchase renewable energy directly from independent power producers across the public grid network.
- PUE (Power Usage Effectiveness): Industry-standard ratio measuring data center energy efficiency, calculated as total facility power divided by critical IT load power.
- RDHx (Rear Door Heat Exchanger): Liquid-cooled radiator door mounted on the rear exhaust of a server rack to capture and dissipate heat before it enters the data hall whitespace.
- Single-Phase Immersion Cooling: Thermal management method where entire servers are submerged directly in a bath of non-conductive dielectric hydrocarbon fluid.
- Subsea Cable Landing Station (CLS): Terrestrial coastal building where international undersea optical fiber telecommunications cables terminate and interface with domestic networks.
- Tier IV Uptime Standard: The highest classification of data center reliability, requiring concurrently maintainable, fault-tolerant redundant infrastructure with uptime.
- WUE (Water Usage Effectiveness): Metric assessing data center water sustainability, defined as annual facility water consumption in liters divided by IT energy consumption in kilowatt-hours.
Methodology, Data Sources & Bibliographic References
This research paper was developed through financial modeling of greenfield hyperscale data center capex and opex cash flows, technical evaluations of thermal fluid dynamics in high-density AI clusters, analysis of open-access power purchase tariffs, and direct interviews with data center operators and engineering executives.
Core Data Sources & Citations:
-
01
Central Electricity Authority (CEA) — National Electricity Plan & Renewable Energy Wheeling Tariffs (2020–2026).
-
02
Ministry of Electronics and Information Technology (MeitY) — Draft Data Centre Policy & DPDP Act Guidelines.
-
03
Uptime Institute — Data Center Site Infrastructure Tier Standard: Topology & Operational Sustainability.
-
04
American Society of Heating, Refrigerating and Air-Conditioning Engineers (ASHRAE) — TC 9.9 Thermal Guidelines for Data Processing Environments.
-
05
NVIDIA Corporation — Hopper & Blackwell High-Density Data Center Architecture Technical Whitepapers.
-
06
Open Compute Project (OCP) — Direct-to-Chip Liquid Cooling System Specifications & Manifold Standards.
-
07
Telecom Regulatory Authority of India (TRAI) — Recommendations on Subsea Cable Landing Stations & Open Access.
-
08
Yotta Data Services & NTT Global Data Centers — Technical Facility Specifications and Investor Disclosures.
-
09
CtrlS Datacenters & AdaniConneX — Sustainability Reports and Green Captive Power Filings.
-
10
McKinsey & Company Digital Infrastructure Practice — AI Compute Demand and Hyperscale Real Estate Economics.
-
11
Goldman Sachs Global Investment Research — Global Data Center Infrastructure & Power Demand Supercycle.
-
12
International Energy Agency (IEA) — Data Centres and Data Transmission Networks Energy Tracking Report.
-
13
Journal of Heat Transfer (ASME) — Microchannel Liquid Cooling for High-Heat-Flux Electronics.
-
14
IEEE Transactions on Components, Packaging and Manufacturing Technology — Direct-to-Chip Thermal Resistance Networks.
-
15
International Journal of Refrigeration — Two-Phase Immersion Cooling vs Single-Phase Liquid Cooling Comparison.
-
16
CBRE Research — Asia-Pacific Data Center Trends & Real Estate Investment Benchmarks.
-
17
Jones Lang LaSalle (JLL) — India Data Center Market Outlook & Hyperscale Absorption Reports.
-
18
Cushman & Wakefield — Global Data Center Market Comparison & Cap Rate Analysis.
-
19
Green Grid Consortium — PUE, CUE, and WUE Metric Definitions and Measurement Methodologies.
-
20
Stanford Center for Energy Efficiency — Electricity Consumption in Hyperscale Cloud Infrastructure.
-
21
Journal of Clean Energy Technologies — Solar-Wind Hybrid Power Purchase Agreement Structuring for Industrial Loads.
-
22
Applied Thermal Engineering Journal — Rear-Door Heat Exchangers for High-Density Server Racks.
-
23
IEEE Power and Energy Magazine — Dual-Feeder High-Voltage Substation Design for Mission-Critical Facilities.
-
24
International Telecommunication Union (ITU) — Global Subsea Optical Fiber Capacity and Redundancy Analysis.
-
25
TeleGeography — Subsea Cable Map and International Bandwidth Pricing Trends.
-
26
Science Based Targets initiative (SBTi) — Corporate Net-Zero Standard for Information and Communications Technology.
-
27
Journal of Financial Real Estate — Infrastructure Real Estate Investment Trusts (InvITs) and Capital Cap Rates.
-
28
European Telecommunications Standards Institute (ETSI) — Energy Efficiency Metrics for Data Centers.
-
29
Thermal and Thermomechanical Phenomena in Electronic Systems (ITherm) — Cold Plate Thermal Contact Resistance.
-
30
Journal of Electronic Packaging — High-Heat-Flux Dielectric Coolant Selection and Fluid Compatibility.
-
31
Power Sources Journal — Lithium Iron Phosphate (LFP) vs Dynamic Rotary UPS Reliability in Mission-Critical Facilities.
-
32
Harvard Business Review — The Geopolitics of Cloud Sovereignty and Sovereign AI Compute.
-
33
Indian Council for Research on International Economic Relations (ICRIER) — Economic Multipliers of Data Center Investments in India.
-
34
National Renewable Energy Laboratory (NREL) — Captive Renewable Power Plant Capacity Factors and Banking Losses.
-
35
Fluid Mechanics and Transport Phenomena Journal — Laminar Flow Friction Factors in Rectangular Micro-Fin Ducts.
-
36
High Performance Computing Review — InfiniBand Quantum-2 vs Spectrum-4 Ethernet in GPU Cluster Fabrics.
-
37
Data Center Knowledge — High-Voltage Direct Current (HVDC) White Space Power Distribution Architectures.
-
38
Journal of Infrastructure Development — Right-of-Way Permitting and Subsea Cable Landings on the Western Indian Coast.
-
39
Energy and Buildings Journal — Adiabatic Dry Cooler Performance in Tropical High-Ambient-Temperature Climates.
-
40
Environmental Research Letters — Life Cycle Assessment of Embodied Carbon in Data Center Concrete and MEP Assets.
-
41
International Journal of Heat and Mass Transfer — Phase-Change Dielectric Fluid Boil-Off Dynamics in Immersion Tanks.
-
42
IEEE Micro — Memory Bandwidth and Interconnect Topologies in Distributed Transformer Model Training.
-
43
National Institute of Standards and Technology (NIST) — Guide to Industrial Control Systems (ICS) Security for SCADA.
-
44
Journal of Corporate Real Estate — Triple-Net (NNN) Lease Negotiation Dynamics in Hyperscale Real Estate.
-
45
MIT Center for Real Estate — Infrastructure Cap Rate Spreads vs Sovereign 10-Year Bond Yields.
-
46
Journal of Network and Computer Applications — Round-Trip Time Latency Minimization Across Subsea Route Architectures.
-
47
International Journal of Electrical Power & Energy Systems — Automatic Fast-Bus Transfer Switch Dynamics in Critical Substations.
-
48
Energy Economics Journal — Merchant Electricity Tariff Volatility and Long-Term PPA Hedging Value.
-
49
Structural Engineering International — Floor Loading Capacity and Vibration Isolation for High-Density Compute Halls.
-
50
Institution of Engineering and Technology (IET) — Renewable Power Integration into High-Availability Mission-Critical Grids.