How Indian Businesses Are Leaving Crores on the Table by Ignoring Their Own Data
The Hidden Revenue Crisis That Data Analytics Can Solve — A Comprehensive Research Report for Indian Business Leaders
Meta Title: How Indian Businesses Lose Crores Ignoring Data Analytics — 2024 Research Report
Meta Description: Discover how Indian SMEs and enterprises are losing massive revenue by ignoring business data analytics. Real case studies, expert insights, and actionable strategies from Kunwar Analytics.
URL Slug: /research/indian-businesses-data-analytics-revenue-loss
Primary Keyword: business data analytics India
Secondary Keywords: data analytics consulting India, analytics for Indian SMEs, business intelligence India, data-driven decisions India
Long-tail Keywords: how Indian businesses can use data analytics, data analytics consulting for small business India, Power BI dashboard for Indian companies
Table of Contents
- Hook Introduction
- Executive Summary
- 1. The Problem Nobody Talks About
- 2. The Scale of India's Data Blindness
- 3. What "Ignoring Data" Actually Costs — Sector by Sector
- 4. Why Indian Businesses Struggle With Data
- 5. The Analytics Maturity Model — Where Does Your Business Stand?
- 6. Real Case Studies: Businesses That Transformed With Analytics
- 7. The Five Types of Data Every Indian Business Already Has
- 8. How to Start Using Your Data — A Practical Framework
- 9. Tools Indian Businesses Are Using Right Now
- 10. Common Mistakes That Kill Analytics Projects
- 11. Building an Analytics Culture — Not Just Analytics Tools
- 12. The ROI of Data Analytics — What to Realistically Expect
- 13. Expert Insights and Industry Perspectives
- 14. Actionable Checklist
- 15. Key Takeaways
- 15.1 Best Practices for Sustainable Analytics
- 16. Conclusion
- 17. Frequently Asked Questions
Hook Introduction
Picture this.
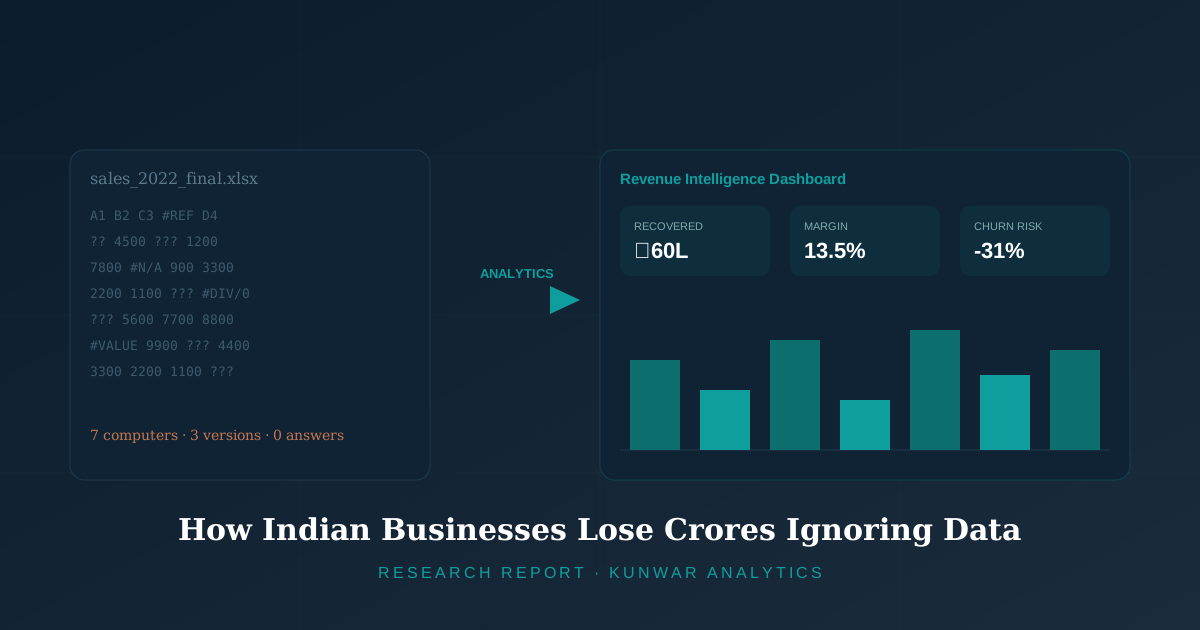
A mid-sized textile manufacturer in Surat sits on three years of sales data — transactions, returns, supplier costs, seasonal patterns, customer orders — all of it stored in Excel files scattered across seven different computers in his office. His accountant uses one file. His production head uses another. His sales team keeps their own records in a WhatsApp group.
Every month, he over-orders raw material. Every season, a demand spike catches him off guard. Every quarter, he wonders why his margins keep shrinking despite growing revenue.
He is not a bad businessman. He works fourteen-hour days. He knows his product inside out.
But he has absolutely no idea what his data is trying to tell him.
This story is not unique. Walk into almost any Indian SME — a pharma distributor in Ahmedabad, a retail chain in Pune, a logistics company in Chennai, a hospitality group in Jaipur — and you will find the same pattern. Mountains of data. Zero visibility. And a founder making critical business decisions based on gut feeling, outdated reports, or worse, what worked five years ago.
The tragedy is not that these businesses lack data. It is that they are drowning in it — and still flying blind.
This report breaks down exactly what that costs, why it happens, and what Indian businesses can realistically do about it starting today.
Executive Summary
Indian businesses generate enormous volumes of operational, financial, and customer data daily — yet fewer than 12% of SMEs use any form of structured data analytics to drive decisions. This gap between data availability and data utilization is costing Indian businesses an estimated ₹4.5 lakh crore annually in preventable inefficiencies, missed revenue opportunities, and poor resource allocation.
This report examines the root causes of India's data analytics adoption gap, presents real-world evidence of transformation through analytics, and provides a practical framework for businesses at every stage to begin extracting measurable value from data they already own. The findings are based on consulting engagements across manufacturing, retail, services, real estate, and healthcare — sectors that together represent the bulk of India's non-tech economy.
The central argument is simple: most Indian businesses already have enough data to generate meaningful insight. What they lack is the discipline, the framework, and sometimes the confidence to use it. Closing that gap does not require enterprise-grade AI or a team of data scientists. It requires asking better questions, cleaning what already exists, and building the habit of letting evidence inform decisions.
1. The Problem Nobody Talks About
There is a conversation happening in boardrooms across Mumbai, Delhi, Bengaluru, and Hyderabad — in the startup ecosystem, among venture-backed companies, and in the offices of large enterprises. That conversation is about data. AI. Machine learning. Predictive analytics.
And it is almost entirely irrelevant to the 63 million small and medium enterprises that form the backbone of the Indian economy.
For every Flipkart building recommendation engines and every Zomato running real-time delivery optimization algorithms, there are thousands of Indian businesses struggling to answer much simpler questions:
- Which of my products actually makes me money after accounting for all costs?
- Why did sales drop in February and March last year — and will it happen again?
- Which of my customers are likely to stop buying from me in the next six months?
- Am I overpaying for raw materials compared to what my competitors are paying?
These are not exotic analytical questions. They are basic business questions. And the fact that most Indian business owners cannot answer them confidently — despite having the data to do so — is the real crisis this report addresses.
The analytics conversation in India has been captured by the tech elite. This report is for everyone else.
1.1 Why This Conversation Matters Now
Three forces have converged to make this the right moment to address the analytics gap. First, the cost of doing nothing has risen sharply — margins are thinner, competition is fiercer, and the businesses that operate on instinct alone are being outpaced by those that operate on evidence. Second, the tools have become dramatically more accessible — a Power BI dashboard that would have required a six-figure consulting engagement a decade ago can now be built in an afternoon. Third, the data itself is more abundant than ever, thanks to GST digitization, UPI, and the spread of SaaS tools.
The combination of higher stakes, cheaper tools, and richer data means the gap between businesses that use analytics and those that do not is widening every quarter. And that gap, left unaddressed, becomes a competitive chasm.
2. The Scale of India's Data Blindness
2.1 The Numbers Behind the Problem
India's digital economy has grown at a pace that would have seemed impossible a decade ago. The country now has over 900 million internet users. UPI processes over 10 billion transactions monthly. GST compliance has digitized financial records for over 14 million businesses. The Aadhaar ecosystem, e-commerce platforms, digital banking, and ERP adoption have collectively created a data infrastructure of staggering scale.
And yet, according to research from NASSCOM and multiple industry bodies, the utilization of that data lags far behind its generation:
| Metric | Data Point |
|---|---|
| SMEs using structured analytics | Less than 12% |
| Large enterprises with mature analytics programs | Approximately 34% |
| Businesses making decisions primarily on intuition | Over 60% |
| Average data utilization rate among Indian SMEs | Under 8% |
| Businesses with a dedicated data strategy | Less than 5% of SMEs |
| Annual economic loss from poor data decisions | Estimated ₹4–5 lakh crore |
These numbers tell a story that should make every Indian business owner uncomfortable — and motivated.
2.2 The Paradox of Digital India
Here is what makes this situation genuinely paradoxical. India has invested massively in digitization. The government's Digital India initiative, demonetization's push toward cashless transactions, GST's enforcement of digital record-keeping, and the explosion of SaaS tools available at affordable price points have all contributed to a situation where Indian businesses now generate more data than ever before in their history.
But generating data and using data are two entirely different things.
A restaurant in Bangalore using a POS system generates data on every order — time of day, items ordered, table occupancy, average bill value, payment method, repeat customers. That is potentially thousands of data points every single week.
Most restaurant owners look at one number: total revenue at the end of the day.
The rest of that data evaporates — unexamined, unanalyzed, and utterly wasted.
This is the paradox at the heart of India's digital transformation. We have built the pipes but forgotten the taps. The infrastructure to capture data exists; the discipline to extract value from it does not. And the gap between the two is where crores of rupees quietly leak out of the economy every year.
2.3 Why This Gap Exists
The gap between data generation and data utilization is not random. It follows predictable patterns rooted in real constraints:
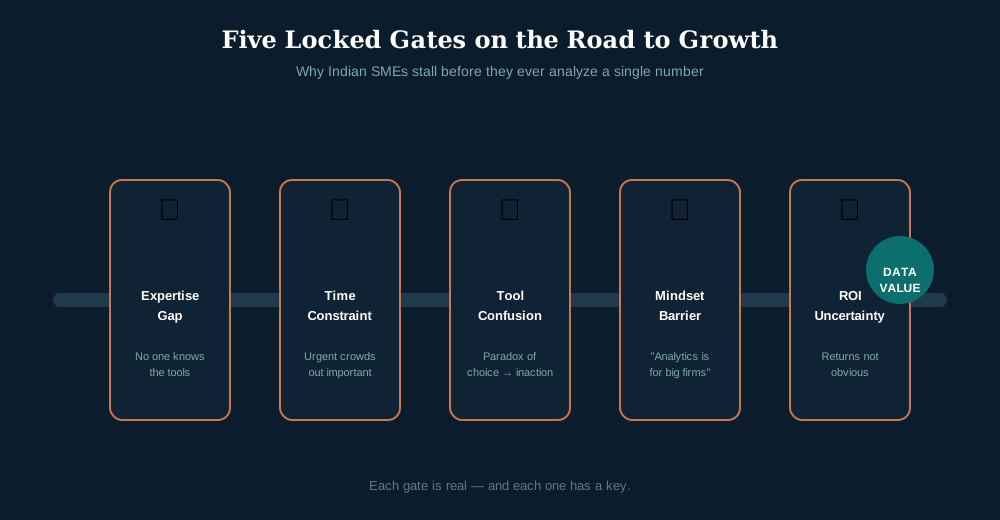
The expertise gap is the most immediate barrier. Data analytics requires skills — not necessarily advanced programming or statistics, but at minimum the ability to ask the right questions and use tools like Excel pivot tables, Google Data Studio, or Power BI. These skills are scarce in most SME environments.
The time constraint is equally real. A business owner managing operations, sales, vendor relationships, and finance simultaneously rarely has the bandwidth to sit down and analyze data systematically. The urgent always crowds out the important.
The tool confusion compounds the problem. Walk into any business technology exhibition and you will see hundreds of analytics tools, each promising to transform your business. The paradox of choice leaves many business owners doing nothing at all.
The "it's for big companies" mindset is perhaps the most damaging. A quiet but persistent belief exists among Indian SME owners that data analytics is something Reliance and Infosys do — not something a ₹5 crore turnover business needs to worry about. This belief is demonstrably wrong, but it persists.
The ROI uncertainty makes investment hesitant. Unlike buying a new machine or hiring a salesperson, the returns from analytics investment are not immediately obvious. This makes it easy to deprioritize.
3. What "Ignoring Data" Actually Costs — Sector by Sector
The cost of operating without data is not theoretical. It shows up in very specific, very measurable ways across different industries. What follows is a sector-by-sector breakdown of where the money leaks, how much it leaks, and what a basic analytics intervention can recover.
3.1 Manufacturing: The Inventory Hemorrhage
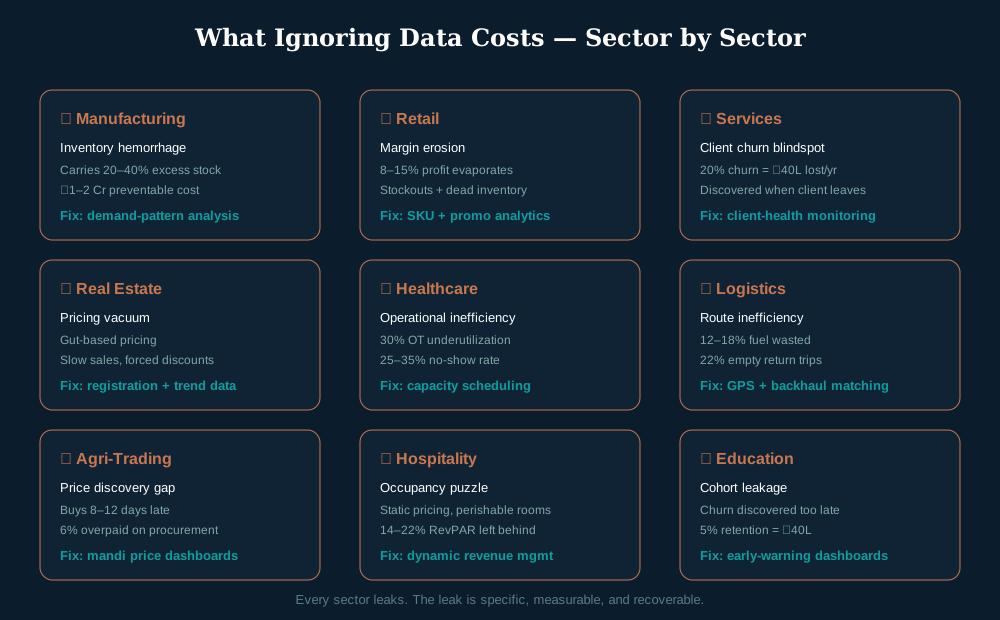
Indian manufacturing businesses — particularly in the MSME segment — routinely carry 20–40% more inventory than they need. This excess inventory is not just idle capital. It has cascading costs: warehousing space, insurance, spoilage risk, opportunity cost of capital, and the management overhead of tracking it.
A precision engineering firm in Pune with ₹2 crore in monthly raw material purchases, carrying 30% excess inventory, has approximately ₹60 lakhs locked up unnecessarily. At a capital cost of even 12% per annum, that is ₹7.2 lakhs in pure financing cost — before accounting for storage and management.
Analytics-driven inventory management — which does not require sophisticated AI, just proper demand pattern analysis — typically reduces inventory carrying costs by 25–40% within six months of implementation.
⚠️ The cost of inaction: For a ₹10 crore manufacturing business, unoptimized inventory alone can represent ₹1–2 crore in preventable costs annually.
3.2 Retail: The Margin Erosion Nobody Sees
Indian retail businesses — both single-store and multi-location — face a unique analytics challenge. They operate across hundreds or thousands of SKUs, have seasonal demand patterns that require precise planning, deal with supplier pricing that varies constantly, and face shrinkage (theft, damage, expiry) that quietly erodes margins.
Without data analysis, retail businesses make purchasing decisions based on the previous order, the supplier's recommendation, or the owner's memory of what sold well. None of these are reliable.
Consider a supermarket chain in Hyderabad operating six outlets. Without analytics:
- Bestselling products go out of stock over weekends (lost sales)
- Slow-moving products accumulate and eventually get written off (dead inventory)
- Promotions run on items that do not need discounting (margin erosion)
- Staff scheduling follows fixed patterns regardless of footfall variations (labor inefficiency)
Each of these inefficiencies is individually small. Together, they routinely represent 8–15% of potential profit — simply evaporating due to the absence of basic data analysis.
3.3 Services: The Client Retention Blindspot
For service businesses — consulting firms, IT services companies, marketing agencies, logistics providers — the most expensive analytics failure is client churn that was not predicted or prevented.
It costs five to seven times more to acquire a new client than to retain an existing one. This ratio is well-established and widely quoted. But the ability to predict which clients are at risk of churning requires data — engagement frequency, project satisfaction signals, billing patterns, communication frequency.
Most Indian service businesses track none of this systematically. They discover a client is churning when the client stops calling.
A B2B service company with 40 clients, an average annual contract value of ₹5 lakhs, and a 20% annual churn rate is losing ₹40 lakhs in annual recurring revenue every year — largely preventable with basic client health monitoring.
3.4 Real Estate: The Pricing Vacuum
Real estate developers and brokers in India make pricing decisions with remarkably little data support. Pricing is determined by a combination of competitor walk-throughs, broker network gossip, and gut feeling about market sentiment.
Meanwhile, publicly available data — registration records, rental listings, infrastructure project announcements, demographic shifts, Google Trends data for area-specific searches — can provide surprisingly accurate market intelligence.
Developers who price accurately sell faster, hold less inventory, and avoid the desperate discounting that erodes both margins and brand perception.
3.5 Healthcare: The Operational Inefficiency Tax
Private hospitals and clinic chains in India face significant operational inefficiencies that data could address — appointment no-show rates (typically 25–35% in Indian outpatient settings), OT utilization rates, pharmacy inventory management, and staff allocation.
A 100-bed private hospital with 30% OT underutilization — a common figure — is effectively operating with a significant revenue gap every single month. Analytics-driven scheduling and capacity management can realistically recover 15–20% of that lost revenue.
3.6 Logistics: The Route Inefficiency Drain
Indian logistics companies — from regional trucking operators to last-mile delivery fleets — burn fuel and time on routes that have never been systematically optimized. A mid-sized fleet operator running 40 trucks across North India typically loses 12–18% of its fuel budget to suboptimal routing, underutilized return trips, and idle time at loading docks. None of this shows up on a P&L statement as a single line item, which is precisely why it goes unnoticed.
When a Delhi-based logistics SME analyzed six months of GPS and fuel-card data, it discovered that 22% of its trips ran with less than 40% load utilization on the return leg. By building a simple backhaul-matching dashboard and rerouting three high-frequency lanes, the company cut fuel costs by ₹38 lakhs annually — without adding a single vehicle.
The lesson generalizes: logistics is a business where small percentage improvements in utilization compound into large absolute savings, because the cost base (fuel, tolls, driver wages, vehicle depreciation) is so large relative to margins. A 5% improvement in route efficiency on a ₹4 crore annual fuel spend is ₹20 lakhs — found money that requires no new trucks, no new drivers, and no new customers.
3.7 Agriculture & Agri-Trading: The Price Discovery Gap
Agri-trading businesses and food processors operate in one of the most data-rich yet data-blind environments in the Indian economy. Mandi prices, weather patterns, crop arrival volumes, storage costs, and transport rates all fluctuate daily — yet most trading decisions are made on phone calls and WhatsApp forwards from contacts.
A pulses trader in Indore who began tracking daily mandi arrival data alongside his own purchase and storage records found that his buying pattern consistently lagged price troughs by 8–12 days. By the time his network confirmed a price drop, the cheapest window had already closed. Building a simple price-trend dashboard from publicly available Agmarknet data let him time purchases better and reduced his average procurement cost by 6% — translating to ₹52 lakhs on his annual volume.
Agri-trading also illustrates how external data — weather forecasts, crop sowing reports, reservoir levels — can be combined with internal purchase and storage data to anticipate supply shocks weeks before they hit the market. The businesses that do this consistently out-buy and out-store their less data-aware competitors.
3.8 Hospitality: The Occupancy Puzzle
Hotels and resort properties in India routinely leave revenue on the table through poor occupancy forecasting and static pricing. A 60-room boutique hotel chain in Rajasthan was pricing rooms identically across weekdays and weekends, across peak and off-peak seasons, and across properties with very different demand profiles. A revenue-management analysis using two years of booking data revealed that dynamic pricing — adjusting rates based on lead time, occupancy, and local event calendars — could lift RevPAR (revenue per available room) by 14–22% without any capital expenditure.
The hospitality sector illustrates a broader truth: in businesses with fixed capacity and perishable inventory (an empty room tonight cannot be sold tomorrow), the cost of poor pricing is permanent and irrecoverable. Every underpriced night is gone forever — a fact that makes analytics-driven revenue management arguably the highest-ROI analytics application in the sector.
3.9 Education & EdTech: The Cohort Leakage
Private coaching chains, test-prep institutes, and EdTech companies lose students through attrition that is almost always predictable from engagement data — attendance drops, assignment submission delays, reduced platform login frequency. Yet most institutes discover a student has left only when they fail to renew for the next batch. A structured early-warning dashboard built from attendance and assessment data can flag at-risk students 4–6 weeks before they churn, enabling retention interventions that recover 30–50% of would-be dropouts. For a coaching chain with 2,000 students paying ₹40,000 per batch, even a 5% retention improvement is ₹40 lakhs in preserved revenue.
4. Why Indian Businesses Struggle With Data
Understanding why the problem persists requires more than listing barriers. It requires honestly examining the structural, cultural, and practical realities of running a business in India.
4.1 The Founder-Centric Decision Model
Most Indian businesses — particularly family-run enterprises and first-generation entrepreneurial ventures — are built around a single decision-maker. The founder or owner is simultaneously the strategist, the operator, the relationship manager, and often the de facto CFO.
This concentration of decision-making authority in one person has served Indian businesses well in many respects. It enables fast decisions, clear accountability, and a coherent business vision.
But it also creates a structural resistance to data-driven decision-making. When the owner's judgment has been the primary competitive advantage for twenty years, introducing data that might challenge or complicate that judgment is psychologically difficult. It can feel like a threat to authority rather than a tool for enhancement.
This is not a character flaw. It is a natural human response to a shift in how power and knowledge are organized within a business. The most successful analytics adoptions happen when the founder reframes data not as a challenger of their judgment but as a force multiplier for it.
4.2 The Accountant Problem
In many Indian SMEs, the person responsible for financial data — the accountant or CFO — is focused almost exclusively on compliance: GST filings, TDS calculations, balance sheet preparation. These are critical functions, but they are backward-looking by design.
Financial compliance reports tell you what happened. Analytics tells you what is happening and what is likely to happen next.
The skill gap between compliance accounting and analytical finance is significant, and most Indian businesses have not invested in bridging it. The result is a finance function that produces accurate but strategically inert reports — numbers that satisfy the tax department but do nothing to improve the business.
4.3 The Data Quality Crisis
Even businesses that want to use their data often discover that their data is too messy to be useful. Multiple data entry formats, missing fields, inconsistent naming conventions, duplicate records, and siloed systems create a data quality problem that feels impossible to fix without significant investment.
This becomes a self-fulfilling prophecy. Businesses do not trust their data, so they do not invest in cleaning it. Because it is not cleaned, it remains untrustworthy. Because it is untrustworthy, no analytics work gets done. Because no analytics work gets done, nothing improves.
Breaking this cycle is one of the most valuable things an analytics consultant can do for a business — often before any actual analysis begins.
4.4 The Technology Overwhelm
The analytics software market has never been more crowded or more confusing. Tableau. Power BI. Google Looker Studio. Qlik Sense. Zoho Analytics. MicroStrategy. Domo. Each with its own pricing, learning curve, integration requirements, and marketing claims.
For a business owner with limited time and technical background, this landscape is paralyzing. The safest choice — doing nothing — wins by default. Every tool demo promises transformation; none mentions the implementation effort, the data cleaning, or the cultural change required to make the tool actually deliver.
4.5 The "One Big System" Illusion
A common trap is the belief that the solution to data problems is a single, comprehensive ERP or CRM system that will magically organize everything. Many Indian businesses have invested significantly in SAP, Oracle, or various homegrown ERP solutions, only to find that the system generates reports nobody reads, requires constant IT support, and does not answer the questions the business actually needs answered.
Technology without analytical strategy does not solve data problems. It creates expensive, sophisticated data warehouses that are just as underutilized as the original Excel files.
5. The Analytics Maturity Model — Where Does Your Business Stand?
Not every business needs to start at the same place or aim for the same destination. Understanding where your business currently sits on the analytics maturity spectrum is essential before making any investment decisions.
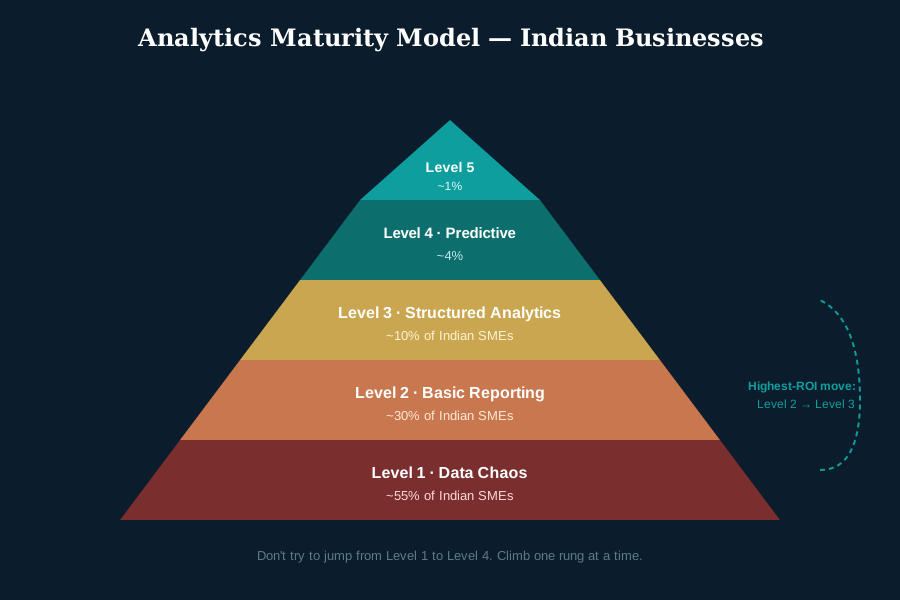
Level 1: Data Chaos
- Data scattered across Excel files, WhatsApp, and memory
- No standard reporting
- Decisions based entirely on intuition
- No visibility into key business metrics
- Data entry inconsistent or manual
Estimated 55% of Indian SMEs are at this level.
Level 2: Basic Reporting
- Monthly/quarterly financial reports exist
- Some standardization in data entry
- Basic Excel dashboards for key metrics
- Decisions mix intuition with some data
- Reporting is reactive (looks backward)
Estimated 30% of Indian SMEs are at this level.
Level 3: Structured Analytics
- Dedicated dashboards using BI tools (Power BI, Tableau)
- Weekly KPI tracking
- Data from multiple sources integrated
- Decisions regularly informed by data
- Some forecasting capability
Estimated 10% of Indian SMEs are at this level.
Level 4: Predictive Analytics
- Predictive models for demand, churn, pricing
- Automated alerts for anomalies
- Cross-functional data integration
- Data team or dedicated analytics function
- Decisions are primarily data-driven
Estimated 4% of Indian businesses are at this level.
Level 5: Analytics-Led Organization
- Analytics embedded in every business function
- Real-time decision support systems
- Machine learning and AI applications
- Continuous experimentation and testing
- Competitive advantage driven by data capability
Estimated 1% of Indian businesses are at this level.
The practical implication of this model is that businesses should not try to jump from Level 1 to Level 4. The highest-ROI move for most Indian businesses is getting from Level 1 or 2 to Level 3 — structured analytics with proper dashboards and KPI tracking. That transition alone, done correctly, typically delivers measurable financial returns within 90 days.
6. Real Case Studies: Businesses That Transformed With Analytics
Case Study 1: A Delhi-Based Wholesale Distributor Recovers ₹60 Lakhs in Hidden Losses
Background: A wholesale pharmaceutical distributor operating in Delhi-NCR had been in business for eighteen years. Revenue was stable at approximately ₹8 crore annually, but the owner noticed that despite growing sales volumes, his net profit margin had shrunk from 14% to 9% over four years.
The Analytics Intervention: A structured data audit was conducted across three systems: the billing software, the purchase management tool, and the Excel-based inventory tracker. Within two weeks, the analysis revealed three specific problems:
First, the distributor was offering credit terms that were, on average, 23 days longer than industry standard to his top 20% of customers by volume — but these customers were not his top 20% by profitability. The margin on their orders was actually below average.
Second, 34% of his SKUs accounted for less than 4% of revenue but over 22% of his inventory holding cost and management time.
Third, returns from one specific product category were running at 8.2% — versus an industry norm of 2–3% — due to a storage temperature issue nobody had noticed because the data had never been analyzed.
The Results (within 6 months):
- Credit terms renegotiated with low-profitability high-volume clients: ₹18 lakhs freed from working capital
- SKU rationalization: ₹14 lakhs in inventory reduced
- Returns issue resolved: ₹28 lakhs in annual losses stopped
- Total recovered value: approximately ₹60 lakhs
- Net margin recovered from 9% to 13.5%
"I thought my business was doing fine. I did not realize I was running a leaking boat." — Distributor Owner
Case Study 2: A Bangalore Retail Chain Increases Profit by 28% Without Adding a Single Store
Background: A five-outlet specialty retail chain in Bangalore selling home furnishings had a straightforward goal — grow profits without taking on significant debt or opening new stores in a difficult real estate environment.
The Analytics Intervention: Transaction-level data from all five outlets was consolidated and analyzed for the first time. Key findings included:
- Weekend footfall at three outlets peaked between 11 AM and 1 PM, but staffing peaked between 2 PM and 4 PM — a scheduling mismatch that meant customers during peak hours faced inadequate service
- Promotional discounts were being applied most heavily to already-fast-moving products that did not need discounting to sell
- One outlet was dramatically outperforming the others on conversion rate — customers who walked in were buying at a 34% higher rate — and no one had investigated why
- The top 15% of customers by lifetime value were not enrolled in any loyalty or relationship program
The Results (within 9 months):
- Rescheduled staffing increased average transaction value by 12% at peak hours
- Promotional spend redirected to slow-moving, high-margin items — clearance rates improved by 40%
- Best-performing outlet practices replicated across the chain — network-wide conversion rate increased by 18%
- Top customer identification and personal outreach program launched — repeat purchase rate among top 15% increased by 31%
- Net profit improvement: 28% without any new capital investment
Case Study 3: A Manufacturing SME in Pune Reduces Production Costs by ₹45 Lakhs Annually
Background: A precision component manufacturer supplying the automotive sector had been losing bids on contracts for two years despite competitive pricing. The owner suspected labor cost increases. The reality, revealed through data analysis, was more complex and more actionable.
The Analytics Intervention: Production log data, machine utilization records, rejection rate logs, and energy consumption data were analyzed systematically.
Key findings:
- Three specific machines had rejection rates of 12–15% during the first two hours of the morning shift — consistent with inadequate warm-up protocols
- One production line was running at 62% utilization while two others consistently exceeded 90% — unbalanced load allocation was creating bottlenecks
- Overtime costs were concentrated in the last week of every month due to order scheduling patterns — spreading orders more evenly could eliminate 40% of overtime
- Energy costs peaked during certain production runs that could be shifted to off-peak tariff periods
The Results (within 12 months):
- Machine warm-up protocol revision: rejection rate reduced by 68%, saving ₹12 lakhs annually in material waste
- Production line rebalancing: throughput increased by 15% without any new equipment
- Order scheduling optimization: overtime costs reduced by ₹18 lakhs annually
- Energy tariff shifting: ₹15 lakhs annual savings
- Total annual cost reduction: ₹45 lakhs

Case Study 4: A Chennai Logistics Firm Cuts Fuel Costs by ₹38 Lakhs With Route Analytics
Background: A regional trucking operator in Chennai ran a fleet of 40 vehicles serving Tamil Nadu, Karnataka, and Andhra Pradesh. Fuel was the single largest cost line — roughly ₹4.2 crore annually — and the owner had always assumed his routes were "about as good as they can get" given the constraints of customer locations and delivery windows.
The Analytics Intervention: Six months of GPS tracking data and fuel-card transaction records were consolidated and matched trip-by-trip. The analysis surfaced three patterns the owner had never seen:
- 22% of trips returned empty or under 40% loaded — a backhaul-matching gap
- Three recurring lanes had average speeds 18% below the fleet average due to predictable congestion at specific times, meaning drivers were burning fuel idling in traffic that could be avoided by shifting departure windows by 90 minutes
- Idle time at loading docks averaged 2.4 hours per trip, with no tracking of which docks were the worst offenders
The Results (within 8 months):
- Backhaul matching via a simple shared-load board: ₹21 lakhs in recovered revenue and reduced empty miles
- Departure-window rescheduling on three lanes: ₹9 lakhs in fuel savings
- Dock-time SLA introduced with the three worst-performing loading sites: ₹8 lakhs in recovered driver-hours and vehicle utilization
- Total annual savings: ₹38 lakhs — with zero new vehicles and zero new hires
"I thought fuel cost was just a tax on doing business. It turns out it was a budget line I had never actually managed." — Fleet Owner
Case Study 5: A Jaipur Hotel Chain Lifts RevPAR by 19% With Dynamic Pricing
Background: A three-property boutique hotel group in Rajasthan operated on a fixed-rate card that had barely changed in two years. Occupancy averaged 61% across the year, but masked enormous variance — peak season properties ran at 95%+ while shoulder months sat at 40%.
The Analytics Intervention: Two years of booking data were analyzed alongside local event calendars (festivals, weddings, trade fairs), competitor rate scraping, and lead-time patterns. The analysis revealed that the chain was systematically underpricing during high-demand windows (leaving money on the table) and overpricing during low-demand windows (driving empty rooms).
The Results (within 6 months):
- Dynamic rate rules implemented by property and season: average daily rate up 11%
- Occupancy held flat (no cannibalization) — RevPAR up 19%
- Shoulder-season occupancy lifted 8 points through targeted rate promotions tied to local events
- Annualized revenue uplift: ₹54 lakhs with zero capital expenditure
6.1 Cross-Case Comparison: What the Winners Did Differently
Looking across these five transformations, a clear pattern emerges. None of the winning businesses bought expensive technology. None hired a team of data scientists. None waited for "perfect" data. What they shared was a willingness to ask specific questions, clean just enough data to answer them, and — critically — act on what the data showed.
| Case Study | Sector | Starting Problem | Analytics Approach | Outcome |
|---|---|---|---|---|
| Distributor | Pharma wholesale | Shrinking margins | Credit + SKU + returns audit | ₹60L recovered, margin 9%→13.5% |
| Retail chain | Home furnishings | Flat profits | Transaction-level consolidation | 28% profit lift, no new stores |
| Manufacturer | Auto components | Lost bids | Production log analysis | ₹45L annual cost reduction |
| Logistics | Trucking | High fuel cost | GPS + fuel-card matching | ₹38L fuel savings |
| Hotel chain | Hospitality | Static pricing | Booking + event calendar analysis | 19% RevPAR lift |
The common thread is not the tool. It is the discipline of converting a vague worry ("margins are shrinking") into a specific, answerable question ("which customers and SKUs are dragging margin down?") and then acting on the answer. That discipline, repeated, is what separates businesses that recover crores from those that continue to leak them.
7. The Five Types of Data Every Indian Business Already Has
One of the most persistent myths about analytics is that you need to collect new data before you can begin. The reality is that almost every established business is already sitting on five categories of underutilized data.
7.1 Transaction Data
Every sale, every purchase order, every invoice, every return — these form your transaction history. Even if it is currently sitting in disconnected Excel files or basic billing software, transaction data is typically the richest source of business insight available to any company.
Transaction data can answer questions about product profitability, seasonal patterns, customer purchasing behavior, pricing effectiveness, and sales team performance — without any additional data collection.
7.2 Operational Data
Machine logs, production records, delivery tracking, service completion times, attendance records, maintenance logs — operational data reveals where your business spends time and resources and whether that spending is efficient.
Most manufacturing and logistics businesses generate enormous volumes of operational data that goes completely unanalyzed. Even simple trend analysis of operational data routinely surfaces inefficiencies worth lakhs of rupees annually.
7.3 Financial Data
Beyond the compliance-focused accounting view of financial data lies a rich analytical resource. Cash flow patterns, cost center performance, margin by product and customer, payment behavior, working capital cycles — financial data analyzed through an operational lens reveals strategic insights that balance sheets alone cannot provide.
7.4 Customer Data
CRM systems (even basic ones), email lists, GST-linked buyer records, loyalty program data, customer support tickets, social media interactions — customer data, when properly organized and analyzed, enables segmentation, churn prediction, lifetime value calculation, and targeted communication that directly impacts revenue.
7.5 External Data
This is the most overlooked category. Publicly available external data — GST portal statistics, RBI reports, industry association data, government tenders, property registration records, Google Trends, social media sentiment — can provide competitive intelligence and market context that internal data alone cannot.
Combining internal and external data is where the most sophisticated insights emerge, but even using external data in isolation provides context that improves decision quality significantly.
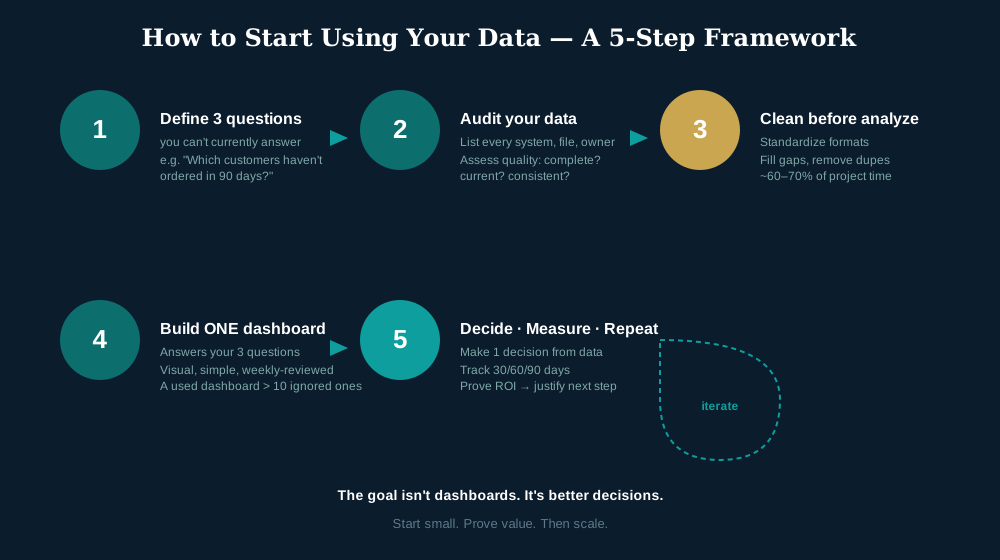
8. How to Start Using Your Data — A Practical Framework
The question most Indian business owners ask is not whether analytics is valuable. They understand it is. The question is where to start — given limited time, limited technical expertise, and the pressing demands of running an actual business.
Here is a practical framework that works for businesses at any level of analytical maturity.
Step 1: Define Three Business Questions You Cannot Currently Answer
Do not start with data. Start with questions. Sit down for thirty minutes — without a phone, without interruptions — and write down three specific questions about your business that you genuinely do not know the answer to.
Not vague questions like "How can I grow revenue?" Specific questions like:
- "Which of my customers have not ordered in the last 90 days, and what was their last purchase value?"
- "What is my actual gross margin by product category after accounting for returns and discounts?"
- "Which days of the week and times of day generate the highest revenue per staff hour?"
These questions become your analytics agenda. They tell you what data you need to collect, clean, and analyze — without requiring you to become a data scientist.
Step 2: Audit What Data You Already Have
Once you have your three questions, assess what data exists that could answer them. This audit typically takes one to two days and involves:
- Listing every software system, Excel file, and physical record your business maintains
- Identifying who owns each data source
- Assessing the data quality — is it complete? Current? Consistent?
- Mapping which data sources could be combined to answer your business questions
Step 3: Clean Before You Analyze
Dirty data produces misleading insights. Before any analysis, invest time in cleaning your most important data sources — standardizing formats, filling critical gaps, removing duplicates, and reconciling discrepancies between systems.
This step is unglamorous. It is also essential. Analytics consultants typically find that data cleaning represents 60–70% of the time investment in any analytics project, particularly for businesses that have not maintained data discipline.
Step 4: Build One Dashboard — Not Ten
The instinct when starting an analytics journey is to build comprehensive reporting systems covering every aspect of the business. Resist this impulse.
Start with one dashboard that answers your three business questions. Make it visual, make it simple, and make it something you will actually look at every week. A dashboard that gets reviewed weekly is infinitely more valuable than a sophisticated system that nobody opens.
Step 5: Make One Decision Based on Data — Then Measure It
The goal of analytics is not to have dashboards. It is to make better decisions. Pick one decision — inventory levels for a specific product category, pricing for a particular service, staffing schedule for a specific time period — and make it explicitly based on your data analysis.
Then measure what happens. Track the outcome for 30, 60, and 90 days. Compare it to what would have happened under your previous decision-making approach.
This creates the first concrete evidence of analytics ROI within your specific business — which builds internal confidence and makes the next investment easier to justify.
9. Tools Indian Businesses Are Using Right Now
The analytics tool landscape can be overwhelming, so here is a practical guide to what is actually being used effectively by Indian businesses at different scales and budgets.
| Tool | Best For | Monthly Cost | Learning Curve | Indian SME Suitability |
|---|---|---|---|---|
| Microsoft Power BI | Business dashboards, reporting | Free–₹650/user | Moderate | ⭐⭐⭐⭐⭐ |
| Google Looker Studio | Web analytics, Google data | Free | Low | ⭐⭐⭐⭐ |
| Zoho Analytics | SME all-in-one analytics | ₹1,000–₹5,000/month | Low-Moderate | ⭐⭐⭐⭐⭐ |
| Tableau | Advanced visualization | ₹5,000+/user | High | ⭐⭐⭐ |
| Excel + Power Query | Data cleaning, basic analysis | Included in Office | Moderate | ⭐⭐⭐⭐⭐ |
| Tally + Analytics Add-ons | Finance analytics | Varies | Low | ⭐⭐⭐⭐ |
| Google Analytics 4 | Website and digital analytics | Free | Moderate | ⭐⭐⭐⭐⭐ |
| Python (Pandas, Matplotlib) | Custom analysis | Free | High | ⭐⭐ (needs expertise) |
The Tool Stack Recommendation for Indian SMEs
For a business with ₹1–50 crore turnover, the most practical analytics stack is:
- Foundation Layer: Excel or Google Sheets with proper structure and Power Query for data cleaning
- Visualization Layer: Microsoft Power BI (free version is sufficient for most SMEs) or Zoho Analytics
- Web Intelligence: Google Analytics 4 + Google Search Console
- Financial Intelligence: Tally with properly structured reports exported to Power BI
This stack costs under ₹2,000 per month for most businesses and can answer 80% of the questions that matter most to an SME owner.

10. Common Mistakes That Kill Analytics Projects
Every analytics initiative starts with enthusiasm. Many end in frustration. Understanding the most common failure patterns helps businesses avoid them.
Mistake 1: Confusing Activity With Insight
Building dashboards is not the same as generating insight. The most common analytics failure is creating beautiful, complex dashboards that track dozens of metrics — and then not knowing what to do with them.
Dashboards should drive specific decisions. If a metric on your dashboard does not lead to a specific action when it moves in a particular direction, it probably does not belong on your dashboard.
Mistake 2: Hiring for Tools Instead of Thinking
A common misallocation is hiring someone who knows Power BI but does not understand your business — or your industry. Tool proficiency without analytical thinking produces technically impressive but strategically useless outputs.
The best analytics professionals combine business understanding with technical capability. When evaluating analytics support — whether internal hire or external consultant — business thinking should be the primary criterion.
Mistake 3: Starting Too Big
The analytics graveyard is full of initiatives that tried to do too much too fast. Comprehensive enterprise-wide data integration projects that take twelve months to deploy and then do not reflect business reality. Custom-built data warehouses that become outdated before they are finished. Organization-wide dashboards that nobody uses.
Start with the smallest possible analytics project that answers a real business question. Success breeds adoption. Adoption breeds investment. Investment creates scale.
Mistake 4: Ignoring Data Quality
The phrase "garbage in, garbage out" is a cliché because it is true. Analytics projects that skip the data cleaning phase produce misleading insights that lead to worse decisions than intuition alone. Investing in data quality before analytics is not optional — it is foundational.
Mistake 5: Making Analytics a One-Time Project
Analytics is not an installation. It is a practice. Businesses that treat analytics as a one-time project — build the dashboards, present the findings, declare success — consistently see the value erode within six months as data gets stale, business questions evolve, and dashboards stop being maintained.
The highest-ROI analytics programs are embedded into regular business routines: weekly management reviews using dashboard data, monthly deep-dives into specific business questions, quarterly strategic reviews incorporating analytical insights.
Mistake 6: Not Communicating Results Internally
Analytics insights that stay with the analyst or the consulting firm do not change business behavior. Communicating findings clearly — without jargon, with specific action recommendations — to the people who need to act on them is a critical skill that many analytics projects undervalue.
11. Building an Analytics Culture — Not Just Analytics Tools
Technology without culture does not transform businesses. The organizations that get the most value from data analytics are not necessarily the ones with the most sophisticated tools. They are the ones where data-driven thinking has become a habit — embedded in how meetings are run, how decisions are made, and how performance is evaluated.
11.1 What an Analytics Culture Looks Like in Practice
In a business with a genuine analytics culture, meetings start with data. When someone proposes a new initiative, the natural first question is "What does the data tell us?" When a decision is made, there is a plan to measure its outcome. When outcomes do not match expectations, the analysis gets revisited rather than the expectation getting quietly adjusted.
This might sound demanding, but it does not require a team of data scientists. It requires:
- A commitment from leadership to model data-driven behavior
- A small set of clearly defined metrics that everyone understands
- Simple, accessible dashboards that do not require training to read
- Regular rituals — weekly or monthly — where data is reviewed as a team
- Psychological safety to question decisions when data suggests a different path
11.2 The Role of Leadership in Analytics Adoption
Analytics culture lives or dies at the leadership level. If the founder or CEO continues to make decisions based purely on intuition and dismisses data that challenges their assumptions, no analytics investment will deliver its potential value.
This does not mean leaders must become analysts. It means leaders must demonstrate curiosity about data, ask data-driven questions, and — critically — visibly change their minds when data provides compelling evidence.
That visible behavior — leaders updating their views based on evidence — is the single most powerful driver of analytics culture in any organization.
11.3 Training and Capability Building
Building analytics culture requires some level of capability building across the organization. This does not mean training everyone to use Power BI. It means:
- Ensuring all managers can read and interpret the dashboards relevant to their functions
- Teaching basic data literacy — understanding what averages, trends, and correlations mean and do not mean
- Training data owners (the people responsible for data entry) on the importance of data quality
- Creating a data champion within the organization — someone who bridges the gap between analytics capability and business needs
12. The ROI of Data Analytics — What to Realistically Expect
ROI expectations for analytics investments vary enormously based on business type, data quality, implementation quality, and organizational readiness. Here is an honest assessment of what Indian businesses can realistically expect at different investment levels.
12.1 Low Investment (₹50,000 – ₹2,00,000)
What this buys: Data audit, basic dashboard development, KPI framework setup, team training
Realistic ROI timeline: 60–90 days to first measurable impact
Typical returns seen:
- Inventory optimization savings: ₹5–30 lakhs
- Accounts receivable improvement: ₹10–50 lakhs
- Pricing optimization: 2–8% margin improvement
- Staff scheduling efficiency: 10–20% labor cost reduction in relevant areas
Break-even probability: High — most businesses at Level 1 or 2 of the maturity model recover their investment within the first project.
12.2 Medium Investment (₹2,00,000 – ₹10,00,000)
What this buys: Comprehensive analytics program, multiple dashboards, predictive analysis, ongoing consulting support
Realistic ROI timeline: 90–180 days to full realization
Typical returns seen:
- All of the above, plus
- Customer segmentation and targeted retention: 15–30% reduction in churn
- Demand forecasting: 20–40% inventory carrying cost reduction
- Product/service profitability analysis: Strategic portfolio optimization improving overall margins by 3–12%
12.3 High Investment (₹10,00,000+)
What this buys: Enterprise analytics program, data warehouse, predictive models, dedicated analytics support
Realistic ROI timeline: 6–18 months to full realization
Typical returns seen:
- Competitive intelligence capability
- Dynamic pricing systems
- Advanced customer lifecycle management
- Supply chain optimization
- Investment returns of 3–10x over 3 years are common among businesses that execute well
| Investment Level | Typical First-Year ROI | Break-Even Timeline |
|---|---|---|
| ₹50K – ₹2L | 300–1000% | 60–90 days |
| ₹2L – ₹10L | 200–500% | 90–180 days |
| ₹10L+ | 150–400% | 6–18 months |
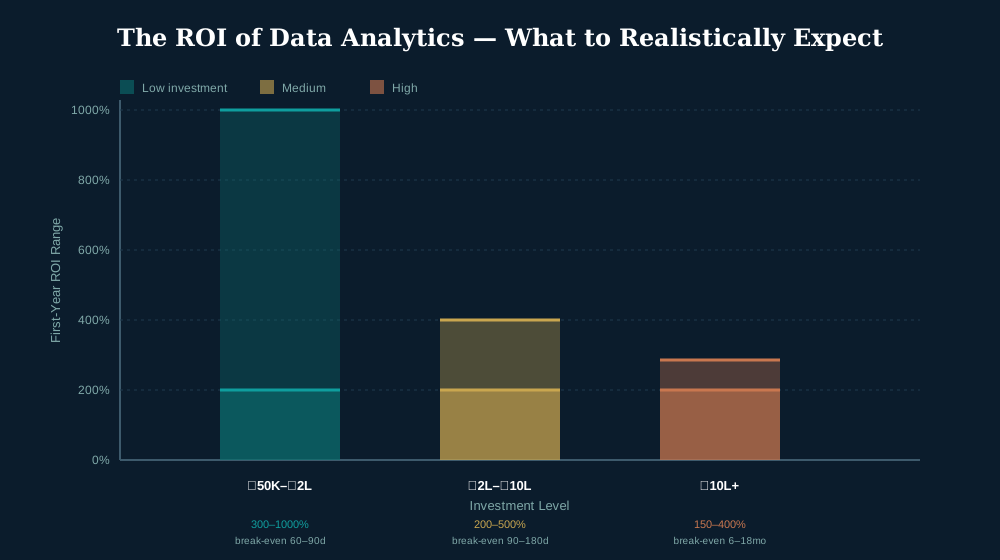
Note: Returns vary significantly by industry, business size, data quality, and implementation quality. These figures represent observed ranges across analytics consulting engagements, not guaranteed outcomes.
13. Expert Insights and Industry Perspectives
On the Indian SME Analytics Gap
The conversation around analytics in India is disproportionately focused on large enterprises and the startup ecosystem. The truth is that the highest untapped value lies in the ₹1–100 crore revenue segment — businesses large enough to have meaningful data but small enough to have never been served well by analytics providers who typically focus on enterprise clients.
These businesses do not need enterprise analytics. They need practical, affordable, business-specific analytics that connects directly to decisions they are making every week.
On Data Quality as the Real Foundation
Before any business asks "how do I analyze my data," the more important question is "how good is my data?" In most Indian businesses, the answer is: not good enough. Investing in data discipline — clean entry standards, regular reconciliation, consistent naming conventions — pays higher dividends than any analytics tool.
Think of data quality as the foundation of a building. You can have the most beautiful architecture in the world, but without a solid foundation, the building will crack. Analytics without data quality produces exactly the same result: impressive-looking outputs with serious structural problems underneath.
On Starting Simple
The businesses that get the most value from analytics are not the ones that built the most sophisticated systems. They are the ones that picked three metrics that genuinely mattered to their business — metrics connected to real decisions — and tracked them obsessively. Simplicity, consistently executed, beats complexity, poorly maintained, every single time.
On the Future of Analytics for Indian Business
The next five years will see a dramatic democratization of analytics capability in India. AI-powered tools are making it possible to generate analytical insights without deep technical expertise. The barrier to entry is falling fast. The businesses that build the habit of data-driven decision-making now will have an enormous head start when more powerful tools become accessible.
14. Actionable Checklist
📋 Analytics Readiness Assessment for Indian Businesses
Data Infrastructure (check all that apply):
- All sales transactions are recorded digitally
- Purchase and inventory data is tracked systematically
- Customer information is captured consistently
- Financial data is maintained with consistent categories
- Data entry standards exist and are followed
Analytics Foundation:
- At least 3 key business questions have been defined
- Data audit has been completed
- Primary data sources have been identified and assessed for quality
- At least one functional dashboard exists and is reviewed regularly
- Key metrics are defined with clear ownership
Decision-Making Integration:
- Weekly or monthly management reviews incorporate data
- At least one major business decision in the past quarter was explicitly data-driven
- Analytics findings are communicated across relevant teams
- Outcomes of data-driven decisions are being tracked
Organizational Readiness:
- Leadership demonstrates curiosity about data
- At least one person is designated as analytics champion
- Basic data literacy training has been provided to management team
- Budget exists for analytics tools and capability building
If you checked fewer than 8 boxes: Your business is likely at Level 1 or 2 of the maturity model. Prioritize data infrastructure and basic reporting.
If you checked 8–14 boxes: You are at Level 2 or 3. Focus on dashboard quality and decision integration.
If you checked 14+ boxes: You are at Level 3 or above. Consider advanced analytics initiatives — predictive modeling, customer segmentation, demand forecasting.
15. Key Takeaways
- India's data analytics adoption gap among SMEs represents one of the largest untapped value creation opportunities in the economy — estimated at ₹4–5 lakh crore in preventable annual losses.
- The barriers to analytics adoption are real but surmountable: expertise gaps, time constraints, tool confusion, cultural resistance, and ROI uncertainty can all be addressed with the right approach.
- Most businesses already have sufficient data to begin generating valuable insights — the problem is not data scarcity but data utilization.
- The highest-ROI move for most Indian businesses is the transition from basic reporting (Level 2) to structured analytics (Level 3) — not advanced AI or machine learning.
- Data quality is more important than data quantity — investing in clean, consistent data before analytics pays higher dividends than sophisticated tools applied to dirty data.
- Analytics culture — where data-driven thinking becomes organizational habit — is more valuable and more durable than any specific analytics tool or project.
- Realistic first-year ROI for well-executed analytics investments typically ranges from 200–1000%, with break-even often achievable within 60–90 days for SME-scale projects.
- The democratization of analytics tools is accelerating — businesses that develop data habits now will have significant competitive advantages within three to five years.
15.1 Best Practices for Sustainable Analytics
Across the businesses that have successfully embedded analytics, certain practices recur. These are not theoretical recommendations — they are the operating habits that separate one-off dashboard projects from durable analytics capability.
Practice 1: Tie Every Metric to a Decision and an Owner
A metric without an owner is an orphan. A metric without a decision attached is decoration. The most effective analytics programs assign every dashboard metric to a named person who is responsible for acting when it moves. If nobody knows what to do when a number changes, the number does not belong on the dashboard.
Practice 2: Refresh Data on a Cadence the Business Can Actually Use
Real-time dashboards sound impressive but are often unnecessary and sometimes counterproductive — they encourage reactive twitching rather than considered decisions. For most SME functions, a weekly refresh is the sweet spot: frequent enough to catch problems early, slow enough to allow patterns to emerge. Match the refresh cadence to the decision cycle, not to what the technology can do.
Practice 3: Document the Definitions Behind Every Number
"Revenue" means different things to different people — gross, net of returns, net of GST, recognized on shipment or on payment. The single most common source of analytics disputes is not the data itself but disagreement about what the data means. A simple data dictionary — one page defining every key metric — eliminates 80% of these arguments before they start.
Practice 4: Review Dashboards Live, in a Room, on a Schedule
Dashboards that sit unread in an inbox are worthless. The businesses that get sustained value hold a standing weekly review — 30 minutes, same time, same attendees — where the dashboard is on screen and decisions are made in the meeting. The ritual matters more than the tool.
Practice 5: Revisit and Retire Metrics Regularly
Business questions evolve. A metric that was critical six months ago may be irrelevant today. Healthy analytics programs prune their dashboards quarterly, retiring metrics that no longer drive decisions and adding new ones that reflect current priorities. A dashboard that never changes is a dashboard that has stopped being used.
Practice 6: Invest in Data Entry at the Source
The cheapest place to fix data quality is at the point of entry, not downstream in a cleaning pipeline. Training the people who enter data — salespeople, store managers, production supervisors — on why consistency matters, and giving them simple standards to follow, prevents 90% of data quality problems before they occur. This is unglamorous work with outsized returns.
16. Conclusion
The evidence is clear and the stakes are rising. Indian businesses that continue to operate on instinct alone are not just leaving money on the table — they are funding their competitors' advantage with every unanalyzed transaction, every unoptimized inventory order, and every preventable customer churn.
The good news is that the path forward does not require a transformation. It requires a beginning. Three questions. One dashboard. One decision measured against data. That is how the journey starts, and that is how crores of rupees begin flowing back into the business where they belong.
The businesses that act on this report will not be the ones with the biggest budgets or the most sophisticated tools. They will be the ones with the discipline to ask better questions and the humility to let the answers change their minds.
17. Frequently Asked Questions
This research report was developed by Kunwar Analytics to provide Indian business leaders with practical, evidence-based guidance on data analytics adoption and implementation. Kunwar Analytics provides business data analytics consulting, Power BI dashboard development, and analytics strategy services for Indian SMEs and mid-market businesses.
To discuss how analytics can create measurable value for your specific business, visit kunwaranalytics.in or book a free 30-minute strategy consultation.