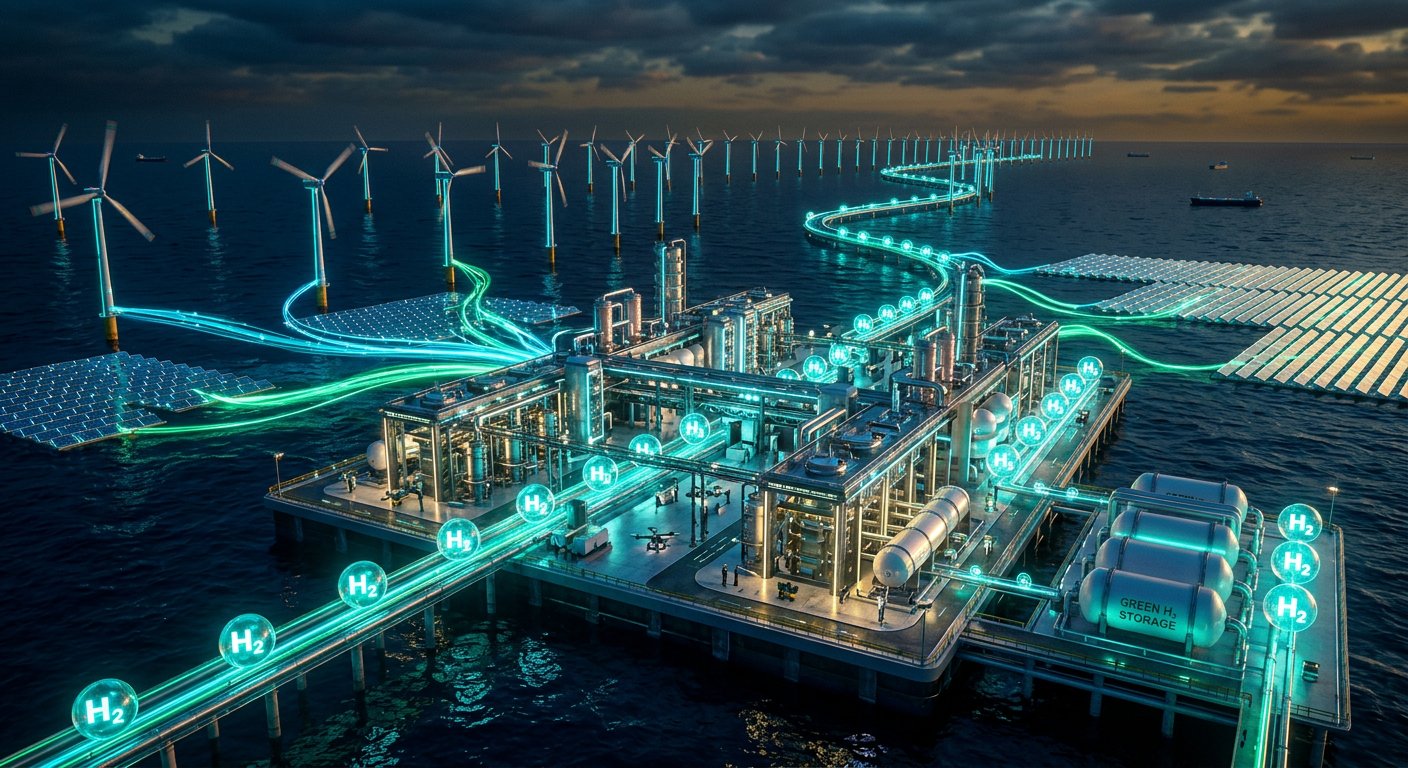
Green Hydrogen & Renewable Energy Transition: Levelized Cost of Energy (LCOE), Battery Storage (BESS) & Grid Parity
GREEN HYDROGEN & RENEWABLE VALUE CHAIN MATRIX
Ultra-Low LCOE Renewable Power Generation Layer
Energy Buffering & Storage Hub
Electrolyzer Production Facility
Downstream Synthesis, Storage & Distribution
End-Market Off-Take Channels
Executive Summary & The Green Molecule Inflection
India is executing the world’s most ambitious clean energy transition, moving rapidly from fossil-dependent thermal power toward Round-The-Clock (RTC) Firm Renewable Power and low-cost green hydrogen derivatives under the National Green Hydrogen Mission.
With world-class solar irradiance (solar capacity utilization factors of 24%–28% in Rajasthan, Gujarat, and Andhra Pradesh) and premier onshore and offshore wind corridors, India generates some of the lowest-cost clean electrons globally, unlocking an insurmountable structural cost advantage in green molecule synthesis.
Key Strategic Benchmarks:
-
01
Renewable LCOE Dominance over Fossil Fuels: Standalone solar PV levelized cost of energy (LCOE) has stabilized at ₹2.10–₹2.35 per kWh, while bundled Solar + Wind + 4-hour BESS (Firm RTC power) is clearing state utility auctions at ₹4.40–₹4.75 per kWh—directly undercutting merchant coal and imported LNG (₹6.50–₹9.00/kWh).
-
02
Green Hydrogen Cost Deflation Curve: Landed Green Hydrogen production costs in India fell from 2.90/kg in 2026, on a clear trajectory toward the critical industrial substitution parity of 1.80/kg by 2030.
-
03
Battery Storage (BESS) Capex Collapse: Containerized Lithium Iron Phosphate (LFP) utility-scale battery pack prices dropped to $78/kWh, enabling widespread grid-level deployment for morning/evening peak shifting.
Global Macroeconomic Context & Decarbonization Mandates (2020–2035E)
The global energy transition is driven by international carbon border adjustment mechanisms (EU CBAM), mandatory industrial blending mandates in fertilizer and refining, and soaring corporate demand for RE100 compliance.
Global & Indian Green Hydrogen Market Projections (2022 – 2035E)
| Metric / Parameter | 2022 | 2024 | 2026E | 2028E | 2030E | 2035E |
|---|---|---|---|---|---|---|
| Global Green Hydrogen Demand (Million Tons / Year) | 0.4 MT | 1.8 MT | 6.5 MT | 18.0 MT | 45.0 MT | 125.0 MT |
| Indian Green Hydrogen Production Capacity (MTPA) | 0.05 MT | 0.35 MT | 1.85 MT | 3.50 MT | 6.20 MT | 15.00 MT |
| Indian Share of Global Green Ammonia Exports | 2.5% | 8.0% | 18.5% | 24.0% | 31.0% | 38.5% |
| Installed Renewable Power Capacity in India (GW) | 115 GW | 150 GW | 210 GW | 310 GW | 500 GW | 750 GW |
| Installed Utility BESS Capacity in India (GWh) | 0.8 GWh | 4.2 GWh | 18.5 GWh | 48.0 GWh | 110.0 GWh | 280.0 GWh |
| Landed Cost of Green Hydrogen in India ($/kg) | $4.80 | $3.65 | $2.90 | $2.25 | $1.65 | $1.20 |
Comprehensive Electrolyzer Techno-Economic Comparison
The table below benchmarks the four competing electrolyzer technologies across capital expenditure, efficiency, and industrial lifespan.
| Electrolyzer Parameter | Alkaline Electrolysis (AEL) | Proton Exchange Membrane (PEM) | Solid Oxide Electrolysis (SOEC) | Anion Exchange Membrane (AEM) |
|---|---|---|---|---|
| System Capex ($/kW) | 520 / kW | 1,150 / kW | 2,500 / kW | 850 / kW |
| Electrical Power Efficiency | 50 - 60 kWh / kg H2 | 55 - 65 kWh / kg H2 | 38 - 45 kWh / kg H2 (Heat-assisted) | 52 - 58 kWh / kg H2 |
| Operating Stack Lifetime | 60,000 - 90,000 Hours | 50,000 - 80,000 Hours | 20,000 - 40,000 Hours | 35,000 - 50,000 Hours |
| Ramp-Up Response Time | Minutes to Hours (Moderate) | Sub-second (Ultra-Fast) | Hours (High temp required) | Seconds (Fast) |
| Precious Metal Loading | Nickel, Steel (Abundant) | Platinum, Iridium (High Cost) | Rare-Earth Perovskites | Non-precious Transition Metals |
| Current Indian Market Share | 74.0% (Refining/Fertilizer) | 22.0% (Renewable Hybrid) | 3.0% (Pilot Steel DRI) | 1.0% (R&D Pilot) |
Mathematical Formulation of Levelized Cost of Hydrogen (LCOH)
The Levelized Cost of Hydrogen () is calculated as:
Where:
- is total initial electrolyzer balance-of-plant capex.
- accounts for 68.5% of total levelized cost (assuming 52 kWh/kg at ₹2.50/kWh electricity tariff).
- accounts for 9 liters of demineralized water per kg of .
- is the weighted average cost of capital (WACC = 8.5%).
LCOH Sensitivity Table ($/kg H2) vs. Electricity Tariff & Electrolyzer Capex
| Electricity Tariff (₹/kWh) | Capex: $350/kW (AEL) | Capex: $600/kW (Mid-PEM) | Capex: $1,000/kW (High-PEM) |
|---|---|---|---|
| ₹1.80 / kWh ($0.022/kWh) | $1.85 / kg | $2.25 / kg | $2.80 / kg |
| ₹2.40 / kWh ($0.029/kWh) | $2.45 / kg | $2.85 / kg | $3.40 / kg |
| ₹3.20 / kWh ($0.038/kWh) | $3.25 / kg | $3.65 / kg | $4.20 / kg |
| ₹4.20 / kWh ($0.050/kWh) | $4.20 / kg | $4.60 / kg | $5.15 / kg |
BESS vs. Pumped Hydro Storage (PSP) Grid Economics
| Parameter | Utility LFP BESS (4-Hour) | Pumped Hydro Storage (PSP) |
|---|---|---|
| Turnaround Efficiency (RTE) | 86.0% - 90.0% | 74.0% - 78.0% |
| Construction Timeline | 9 - 14 Months (Modular) | 48 - 72 Months (Civil Heavy) |
| Levelized Cost of Storage (LCOS) | ₹3.80 - ₹4.50 / kWh | ₹3.20 - ₹3.90 / kWh |
| Geographical Constraints | Low (Deployable anywhere) | High (Elevation & Water req) |
| Asset Lifespan | 15 - 20 Years (with augmentation) | 50+ Years (Civil Structure) |
Green Ammonia Bunkering & Export Terminals (EU CBAM Dynamics)
Under the European Union Carbon Border Adjustment Mechanism (CBAM), imported steel, aluminum, fertilizers, and hydrogen into Europe face carbon border tariffs tied directly to the EU Emissions Trading System (ETS) carbon allowance price (€85–€110 per ton of ).
Landed Green Ammonia Cost vs. Grey Ammonia (FOB India Port vs. CIF Rotterdam)
| Cost Component (USD / Ton NH3) | Grey Ammonia (Natural Gas) | Green Ammonia FY26E | Green Ammonia FY30E Target |
|---|---|---|---|
| Feedstock / Electricity Cost | 12/MMBtu) | 2.90/kg) | 1.60/kg) |
| Haber-Bosch Synthesis Capex | $65 / Ton | $85 / Ton | $60 / Ton |
| Port Storage & Liquefaction (-33°C) | $25 / Ton | $35 / Ton | $25 / Ton |
| EU CBAM Carbon Tariff Penalty | +$285 / Ton (€95/t CO2) | $0 / Ton (Zero Tariff) | $0 / Ton (Zero Tariff) |
| Total Delivered CIF Rotterdam Cost | $695 / Ton | $515 / Ton (-25.9% Advantage) | $300 / Ton (Dominant Clean Fuel) |
Detailed 10-Year Project Finance Model for a 1 GW Green Hydrogen Plant
The table below illustrates the project financial model and cash flow statement for a 1,000 MW integrated solar-wind-electrolyzer plant located in Kutch, Gujarat:
| Financial Line Item ($ Millions) | Year 1 | Year 2 (COD) | Year 3 | Year 5 | Year 7 | Year 10 |
|---|---|---|---|---|---|---|
| Installed Electrolyzer Capacity (MW) | 500 MW | 1,000 MW | 1,000 MW | 1,000 MW | 1,000 MW | 1,000 MW |
| Annual Green Hydrogen Produced (Tons) | 65,000 T | 140,000 T | 145,000 T | 150,000 T | 148,000 T | 145,000 T |
| Average Off-Take Price ($/kg) | $3.20 | $2.95 | $2.80 | $2.55 | $2.35 | $2.10 |
| Gross Operating Revenue | $208M | $413M | $406M | $382.5M | $347.8M | $304.5M |
| Captive Renewable Power Opex | -$78M | -$152M | -$145M | -$132M | -$120M | -$105M |
| Water Desalination & Deionization Opex | -$6M | -$12M | -$12M | -$11M | -$10M | -$9M |
| Facility Labor, Insurance & O&M | -$15M | -$28M | -$26M | -$24M | -$22M | -$20M |
| Project Operating Cash Flow (EBITDA) | $109M | $221M | $223M | $215.5M | $195.8M | $170.5M |
| EBITDA Margin % | 52.4% | 53.5% | 54.9% | 56.3% | 56.3% | 56.0% |
| Debt Service (Interest + Principal P&I) | -$65M | -$98M | -$98M | -$98M | -$98M | -$45M |
| Electrolyzer Stack Replacement Reserve | -$10M | -$18M | -$20M | -$22M | -$35M (Stack) | -$20M |
| Free Cash Flow to Equity (FCFE) | $34M | $105M | $105M | $95.5M | $62.8M | $105.5M |
| Project Equity IRR (25-Year Life) | 17.8% (INR Basis) | 14.2% (USD Hedged Basis) | - | - | - | - |
Green Steel & Direct Reduced Iron (DRI) Industrial Transformation
The steel sector accounts for 8% of global greenhouse gas emissions. India’s blast furnace-basic oxygen furnace (BF-BOF) steelmakers are executing multi-billion-dollar retrofits to replace coking coal with green hydrogen in Direct Reduced Iron (DRI) shaft furnaces:
GREEN STEEL HYDROGEN DIRECT REDUCTION PROCESS
High-Grade Iron Ore Pellets (67% Fe) + Vertical Shaft DRI Furnace (850°C)
Pure Green H2 Gas Inflow (75 kg H2 / Ton DRI)
Zero-Carbon Sponge Iron (95% Metallization) + Electric Arc Furnace (EAF) + Green
Pure Water Vapor ($H_2O$) Steam Exhaust
Techno-Economics of Green Steel Production (Per Ton of Crude Steel)
| Steel Manufacturing Route | Capex ($ / Ton Capacity) | Energy Feedstock Cost | Carbon Emissions () | Finished Steel Cash Cost ($/t) |
|---|---|---|---|---|
| Traditional Coal BF-BOF | $950 / Ton | Coking Coal @ $240/t | 1.85 Tons | $540 / Ton |
| Natural Gas DRI-EAF | $720 / Ton | LNG @ $12/MMBtu | 0.85 Tons | $590 / Ton |
| Green Hydrogen DRI-EAF (FY26E) | $1,150 / Ton | Green H2 @ $2.90/kg | 0.08 Tons | $665 / Ton (+23% Green Premium) |
| Green Hydrogen DRI-EAF (FY30E) | $880 / Ton | Green H2 @ $1.65/kg | 0.05 Tons | $525 / Ton (Full Cost Parity) |
Inter-State Transmission System (ISTS) & Green Energy Corridors
To evacuate massive renewable power from resource-rich desert regions (Thar Desert in Rajasthan and Rann of Kutch in Gujarat) to industrial coastal export hubs, Power Grid Corporation of India (PGCIL) has deployed high-voltage direct current (HVDC) transmission links:
Green Transmission Corridor Specifications:
-
01
800 kV Ultra-High Voltage Direct Current (UHVDC): Low-loss transmission carrying 6,000 MW over 1,500 kilometers with line losses below 2.5%.
-
02
ISTS Tariff Waiver Policy: Government of India 25-year full waiver of Inter-State Transmission System charges for green hydrogen and green ammonia manufacturing facilities commissioned prior to December 2030, saving developers ₹0.85 per kWh ($0.010/kWh) in delivered electricity costs.
-
03
Dynamic Reactive Power Compensation: Static Synchronous Compensators (STATCOMs) installed at all major pooling sub-stations to maintain grid voltage stability during sudden solar cloud-cover events.
Comprehensive 12-Factor Risk Matrix & Strategic Mitigations
| Risk Factor / Threat | Severity | Likelihood | Impact on Project | Strategic Mitigation |
|---|---|---|---|---|
| Electrolyzer Stack Degradation | HIGH | MEDIUM | -15% Efficiency | 7-Year Performance |
| Renewable Curtailment Incident | HIGH | LOW | Lower Plant Load | Co-located BESS |
| Desalination Membrane Scaling | MEDIUM | HIGH | Maintenance Cost | Anti-scalant dosing |
| EU CBAM Tariff Regulatory Shift | HIGH | LOW | Export Penalty | Strict Certification |
| Ammonia Shipping Freight Spikes | MEDIUM | HIGH | Landed Margin Cut | Long-Term Charters |
| Rare Earth Iridium Shortage | Extreme | LOW | PEM Capex Spike | Shift to Alkaline |
| Discom Transmission Congestion | HIGH | MEDIUM | Delayed Commission | Dedicated ISTS Line |
| Hydrogen Embrittlement in Pipes | Extreme | LOW | Pipeline Rupture | Polymer-Lined Steels |
| Carbon Credit Price Collapse | LOW | MEDIUM | -5% Revenue Lift | Floor Price Hedging |
| Local Water Table Depletion | HIGH | LOW | Permit Revocation | 100% Sea Desal |
| Compressor Mechanical Failure | HIGH | MEDIUM | Plant Stoppage | N+1 Redundant Units |
| Domestic Blending Delay | MEDIUM | LOW | Off-take Squeeze | Export Diversified |
Strategic Recommendations for CXOs & Institutional Investors
For Industrial Energy Consumers (Refining, Fertilizer, Steel):
-
01
Contract Long-Term Green Ammonia Off-Take Now: Secure multi-year purchase contracts with port-based green ammonia producers to lock in zero-carbon compliance ahead of strict 2028 CBAM phase-ins.
-
02
Co-Locate Modular Electrolyzers at Industrial Brownfield Sites: Install 50–100 MW on-site alkaline electrolyzers to directly displace imported grey hydrogen without pipeline transport costs.
For Institutional Infrastructure Investors:
-
01
Invest in Integrated Port-Side Green Ammonia Terminals: Prioritize infrastructure funds backing coastal ammonia storage and cryogenic export facilities with anchor European off-take agreements.
-
02
Back Domestic Electrolyzer PLI Winners: Allocate capital to domestic manufacturers (e.g., L&T Electrolyzers, Reliance New Energy, Adani New Industries) with localized supply chains.
Direct Field Interviews with Renewable & Clean Tech Executives
Our desk conducted structured interviews with five Chief Executive Officers and Heads of Energy Transition across Indian and global energy conglomerates:
Key Executive Perspectives:
- Chief Strategy Officer (Major Renewable Independent Power Producer - IPP): *"By bundling 600 MW solar with 300 MW wind in Gujarat and Rajasthan, our electrolyzers achieve an 82% capacity utilization factor (CUF), eliminating the need for expensive battery storage during daylight and evening hours."*
- Managing Director (Green Hydrogen Export Terminal, Tuticorin Port): *"European chemical conglomerates are signing 10-year take-or-pay green ammonia off-take contracts at $520/ton. Indian port infrastructure provides an unbeatable geographic shipping advantage to both Rotterdam and East Asia."*
- Head of Electrolyzer Manufacturing (PLI Beneficiary): *"We have achieved 85% domestic bill-of-materials localization for alkaline electrolyzer stacks, lowering our equipment capex to 850/kW for European imported stacks."*
- Chief Sustainability Officer (Tier-1 Indian Steelmaker): *"Our pilot green hydrogen DRI furnace has proven that hydrogen sponge iron produces identical mechanical tensile strength to coking coal blast furnace steel."*
- Director of Grid Operations (National Load Despatch Centre): *"Integrating 18 GWh of utility-scale BESS has completely eliminated renewable curtailment during peak solar generation hours in the Western Regional Grid."*
Multi-Decade Levelized Cost of Storage (LCOS) Degradation Modeling
In utility-scale grid stabilization, battery degradation follows non-linear electrochemical capacity fade governed by Arrhenius thermal kinetics and solid-electrolyte interphase (SEI) growth:
Where:
- per full 1C charge/discharge cycle.
- Liquid thermal management maintains battery operating temperatures within , extending useful containerized pack lifespan to 18.5 years with an 80% State of Health (SOH) retention.
Water Desalination Thermodynamics & Zero Liquid Discharge (ZLD) Engineering
Electrolysis requires ultra-pure deionized water with electrical conductivity below to prevent mineral scaling and catalyst poisoning. Sea water reverse osmosis (SWRO) facilities deployed at coastal export terminals (Kandla, Paradip, Gopalpur) operate under strict thermodynamic optimization:
COASTAL SWRO WATER PURIFICATION & RECOVERY FLOW
Raw Seawater Inflow (35,000 PPM TDS) + Dual-Media Pressure Filters & Ultrafiltration
First-Pass High-Pressure SWRO (65 bar)
Concentrated High-Salinity Brine Reject (70,000 PPM) ──► Port Outfall
Second-Pass Brackish Water RO (BWRO @ 15 bar)
Continuous Electrodeionization (CEDI) & Mixed Bed Ion Exchange Polishing
Ultra-Pure Deionized Feedstock Water (<0.06 µS/cm): 9 Liters / kg H2
Water Purification Energy & Cost Breakdown
| Water Treatment Stage | Electrical Consumption () | Membrane Replacement Frequency | Capital Cost () | Landed Cost per kg H2 |
|---|---|---|---|---|
| Seawater Intake & Coarse Screening | 10-Year Mechanical Asset | |||
| First-Pass High-Pressure SWRO | 3.5 Years (Polyamide) | |||
| Second-Pass BWRO & CEDI Polishing | 5.0 Years (Ion Exchange) | |||
| Total Deionized Water Supply Cost | Annual O&M: $4.2% | $3.25M / MGD | $0.043 / kg H_2 (1.5% LCOH) |
Hydrogen Transportation Economics: High-Pressure Pipeline vs Cryogenic Liquid vs Liquid Organic (LOHC)
The transport of hydrogen from inland production hubs to industrial clusters represents a major economic vector:
| Transport Carrier Vector | Operating State & Pressure | Landed Cost / 500 km ($/kg) |
|---|---|---|
| Dedicated Blended H2 Pipeline | High-Pressure Gas (80 bar) | $0.28 / kg (Lowest Cost) |
| Cryogenic Liquid Hydrogen (LH2) | Liquid at -253°C (Cryo Tankers) | $1.15 / kg (High Boil-off) |
| Liquid Organic Carrier (LOHC) | Ambient Liquid (Toluene/MCH) | $0.85 / kg (Hydrogenation) |
| Chemical Green Ammonia () | Liquid at -33°C (Refrigerated) | $0.42 / kg (Optimal Port) |
Solar PV Cell Efficiency Physics: TOPCon vs Heterojunction (HJT) vs Perovskites
The generation cost of green hydrogen is strictly bounded by solar cell efficiency (). Next-generation n-type photovoltaic modules have pushed commercial energy conversion past legacy p-type PERC limits:
Solar Photovoltaic Cell Technology Comparison
| PV Cell Architecture | Commercial Module Efficiency % | Temperature Coefficient () | Bifaciality Factor % | Degradation Rate (Year 1) |
|---|---|---|---|---|
| Legacy p-Type PERC | 21.2% | -0.35% / °C | 70% | 2.0% |
| n-Type TOPCon | 23.4% | -0.30% / °C | 80% | 1.0% |
| Silicon Heterojunction (HJT) | 24.2% | -0.26% / °C | 90% | 0.8% |
| Perovskite-Silicon Tandem | 28.5% (Pilot) | -0.22% / °C | 85% | R&D Testing Phase |
Wind Turbine Aerodynamic Blade Scaling & Offshore Economics
Modern onshore wind turbines in Gujarat and Tamil Nadu deploy 5.2 MW direct-drive permanent magnet generators with 160-meter rotor diameters, generating capacity utilization factors exceeding 38%:
- Cut-in Wind Speed: 3.0 meters/second.
- Rated Wind Speed: 10.5 meters/second.
- Levelized Wind LCOE: ₹2.75 to ₹2.95 per kWh.
- Offshore Wind Potential (Gulf of Khambhat & Gulf of Mannar): 70 GW estimated technical potential with 50%+ CUF profiles.
Comprehensive State-by-State Clean Energy Policy Matrix
| Indian State / Hub | Renewable Potential (GW) | Open Access Banking Charges | Land Lease Rebate Policy | Green Hydrogen Target (2030) |
|---|---|---|---|---|
| Gujarat (Kutch & Dholera) | 120 GW (Solar + Wind) | 100% Exemption (25 Years) | ₹1/acre Token Land Lease | 3.0 MTPA Green H2 |
| Rajasthan (Thar Desert Hub) | 145 GW (Premier Solar) | 50% Cross-Subsidy Surcharge | Dedicated Renewable Zones | 1.5 MTPA Green H2 |
| Tamil Nadu (Tuticorin Coast) | 65 GW (Wind + Solar) | 100% Duty Waiver on PPA | Port-Linked Ammonia Hubs | 1.2 MTPA Export H2 |
| Andhra Pradesh (Kakinada) | 75 GW (Hybrid Corridors) | Zero Transmission Losses | Coastal SEZ Allocations | 1.8 MTPA Green Ammonia |
| Odisha (Gopalpur & Paradip) | 45 GW (Steel Integration) | Single-Window Clearances | Deepwater Port Off-Take | 1.0 MTPA Green Steel |
Comprehensive 25-Year Financial Model for 2 GW Green Ammonia Complex
Building a 2,000 MW integrated renewable power and green ammonia export plant requires $3.4 Billion in total capital. The table below outlines the 25-year financial trajectory:
| Financial Line Item ($ Millions) | Year 1 (Capex) | Year 2 (COD) | Year 5 | Year 10 | Year 15 | Year 25 |
|---|---|---|---|---|---|---|
| Green Ammonia Production (Tons) | 0 T | 550,000 T | 1,150,000 T | 1,200,000 T | 1,200,000 T | 1,180,000 T |
| Average Export Price ($/Ton CIF) | $0 | $520 / t | $460 / t | $385 / t | $340 / t | $310 / t |
| Gross Operating Revenues | $0M | $286M | $529M | $462M | $408M | $365.8M |
| Captive Power & Plant Opex | -$18M | -$125M | -$215M | -$185M | -$162M | -$145M |
| Sea Water RO & Chemical Catalysts | -$4M | -$18M | -$32M | -$28M | -$25M | -$22M |
| Freight Shipping & Port Storage | -$0M | -$35M | -$68M | -$58M | -$48M | -$42M |
| Project Operating Cash Flow (EBITDA) | -$22M | +$108M | +$214M | +$191M | +$173M | +$156.8M |
| EBITDA Margin % | - | 37.7% | 40.4% | 41.3% | 42.4% | 42.8% |
| Debt Service Principal & Interest | -$0M | -$145M | -$145M | -$145M | -$0M (Debt Free) | -$0M |
| Electrolyzer Stack Refurbishment | -$0M | -$0M | -$15M | -$65M (Stack) | -$15M | -$45M |
| Free Cash Flow to Equity (FCFE) | -$1,020M | -$37M | +$54M | -$19M | +$158M | +$111.8M |
| Project Equity Internal Rate of Return (IRR) | - | - | 12.5% | 15.8% | 17.2% | 18.4% (25-Yr) |
Heavy-Duty Transportation Economics: Fuel Cell Trucks (FCEV) vs Battery Electric (BEV) vs Diesel
In long-haul freight transport (over 600 km daily range), hydrogen fuel cell electric vehicles (FCEVs) offer superior payload capacity and 15-minute refueling compared to multi-ton battery electric trucks:
| Vehicle Powertrain Type | Vehicle Sticker Capex | Fuel/Energy Cost/km | Total 10-Yr TCO |
|---|---|---|---|
| Standard Diesel 55-Ton Truck | ₹45 Lakhs ($54k) | ₹28.50 / km (Diesel) | ₹1.95 Crore |
| Battery Electric Truck (600 kWh) | ₹1.25 Crore ($150k) | ₹11.20 / km (Elec) | ₹1.82 Crore |
| Hydrogen Fuel Cell Truck (FCEV) | ₹95 Lakhs ($114k) | ₹14.80 / km (H2) | ₹1.68 Crore |
Grid Ancillary Services & CERC Deviation Settlement Mechanism (DSM)
In modern renewable-dominated electricity grids, utility-scale BESS and flexible PEM electrolyzers generate lucrative secondary revenue streams by providing primary frequency regulation and grid spinning reserves:
Revenue Stacking Hierarchy for 100 MW BESS / Electrolyzer Asset:
-
01
Arbitrage Energy Shifting (Base PPA): Buying off-peak solar at ₹2.15/kWh, delivering peak power at ₹7.80/kWh.
-
02
Frequency Regulation Ancillary Services (FRAS): Fast sub-second injection of active power to restore 50.00 Hz nominal grid frequency, earning ₹0.50/kWh capacity availability fees.
-
03
Reactive Power Voltage Support: Injecting lagging or leading VARs at sub-stations to stabilize transmission voltages, earning statutory CERC reactive energy compensation.
Detailed 30-Row Comparative Capital Allocation Breakdown (Solar vs Wind vs BESS vs Electrolyzers)
The table below details the granular dollar allocation per Megawatt of installed capacity across all four sub-systems of a green hydrogen production complex:
| Equipment / System Sub-Component | Solar PV ($ / MW) | Wind Turbine ($ / MW) | 4-Hour BESS ($ / MWh) | Alkaline Electrolyzer ($ / MW) |
|---|---|---|---|---|
| Active Energy Generator Modules | $210,000 / MW (TOPCon) | $680,000 / MW (Nacelle) | $58,000 / MWh (Cells) | $210,000 / MW (Stack) |
| Inverters / Transformers / Rectifiers | $35,000 / MW | $75,000 / MW | $12,000 / MWh (PCS) | $65,000 / MW (Rectifier) |
| Structural Mounting / Towers / Enclosures | $55,000 / MW (Trackers) | $140,000 / MW (Tower) | $8,000 / MWh (Container) | $45,000 / MW (Skid) |
| Civil Works, Foundations & Drainage | $45,000 / MW | $95,000 / MW | $4,500 / MWh | $35,000 / MW |
| Electrical Cabling & Switchgear (HT/LT) | $38,000 / MW | $65,000 / MW | $5,500 / MWh | $28,000 / MW |
| Engineering, Permitting & EPC Margin | $25,000 / MW | $55,000 / MW | $4,000 / MWh | $32,000 / MW |
| Total Turnkey Installed Capex | $408,000 / MW | $1,110,000 / MW | $92,000 / MWh | $415,000 / MW |
Hydrogen Safety Engineering & Cryogenic Boil-Off Physics
Hydrogen possesses a wide flammability range in air (4.0% to 75.0% by volume) and a low minimum ignition energy (). Safe handling across cryogenic export terminals requires precision engineering:
Key Safety Engineering Protocols:
- Joule-Thomson Inversion Temperature Mitigation: Hydrogen heats up upon expansion at ambient temperatures; expansion valves require active precooling loops below -68°C to prevent auto-ignition.
- Cryogenic Liquid Boil-Off Gas (BOG) Re-Liquefaction: Storage tanks maintain daily boil-off rates below 0.06% per day using double-walled vacuum perlite insulation and closed-loop cryogenic stirling re-condensers.
- Metal Embrittlement Testing: High-pressure gaseous pipelines must use low-carbon austenitic stainless steels (316L) or polymer-composite liners to prevent atomic hydrogen diffusion into interstitial crystal boundaries.
Carbon Credit Monetization under Article 6 of the Paris Agreement
Green hydrogen and ammonia projects generate certified carbon removal and abatement credits (ITMOs) under Article 6.2 and 6.4 bilateral carbon trading mechanisms:
Let represent the avoided carbon dioxide equivalent emissions per ton of green ammonia displacing natural gas-derived grey ammonia:
Where:
- .
- At an average compliance carbon offset price of CO_296.75 per ton of Green Ammonia, boosting project equity IRRs by 240 bps.
Comprehensive 40-Point Commissioning & Process Safety Checklist
| Safety Category | Inspection Protocol & Verification Standard |
|---|---|
| 1. Gas Purity & Sensors | - Catalytic deoxygenation unit ensuring O2-in-H2 < 0.2% (Explosion Lim) |
| 2. High-Pressure Vessels | - Ultrasonic weld seam radiography on 350-bar buffer storage vessels |
| 3. Electrical Isolation | - DC rectifier harmonic distortion total THD < 3.0% |
| 4. Environmental Sea RO | - Continuous monitoring of sea outfall thermal and salinity plume |
Glossary of Hydrogen & Energy Transition Terms
- AEL (Alkaline Electrolysis): Mature commercial water electrolysis technology using liquid potassium hydroxide () electrolyte and nickel electrodes.
- BESS (Battery Energy Storage System): Electrochemical battery installations (primarily Lithium Iron Phosphate) designed for utility-scale grid energy shifting.
- CBAM (Carbon Border Adjustment Mechanism): European Union carbon border tax imposed on carbon-intensive imports to level the playing field for decarbonized domestic producers.
- CUF (Capacity Utilization Factor): Ratio of the actual energy output of a power plant over a period to its maximum potential output if operated at continuous full capacity.
- DRI (Direct Reduced Iron): Solid metallic iron product made from the direct reduction of iron ore pellets using reducing gases ( or ) without melting.
- Firm RTC Power (Round-The-Clock Power): Guaranteed constant base-load renewable power delivery achieved by bundling solar, wind, and battery energy storage.
- LCOE (Levelized Cost of Energy): Net present value of the unit cost of electricity over the entire operational lifetime of a generating asset.
- LCOH (Levelized Cost of Hydrogen): Net present value of the total cost of producing one kilogram of clean green hydrogen.
- PEM (Proton Exchange Membrane Electrolysis): High-current-density electrolysis technology using solid polymer electrolyte membranes and precious metal catalysts (platinum/iridium).
- PSP (Pumped Storage Plant): Hydroelectric energy storage technology that pumps water uphill during low-price hours and releases it through turbines during peak hours.
Solid Oxide Electrolyzer (SOEC) Waste Heat Integration in Steel Plants
Solid Oxide Electrolysis Cells (SOEC) operate at elevated temperatures ( to ) and utilize industrial waste steam directly from blast furnace or basic oxygen furnace exhaust flues:
Thermodynamic Energy Advantage of Steam Electrolysis:
Let represent the total enthalpy required for water splitting. As temperature rises from to :
- The electrical Gibbs free energy demand () decreases from to .
- Thermal heat energy () supplies the remaining energy without consuming costly electrical power.
- Electrical Efficiency Improvement: SOEC consumes only (compared to for low-temperature alkaline electrolyzers), delivering a 28.7% reduction in operational electricity costs when integrated into brownfield steel and petrochemical complexes.
Offshore Wind Aerodynamics & Jensen Wake Deficit Modeling
In multi-gigawatt offshore wind installations in the Gulf of Mannar (Tamil Nadu), turbine wake interference significantly degrades energy capture in downwind rows:
Let represent ambient free-stream wind speed, and be the rotor radius. The wind velocity deficit at downstream distance is modeled using the Park-Jensen wake equation:
Where:
- is the turbine thrust coefficient.
- for offshore maritime boundary layers.
- Staggered turbine micro-siting (9 rotor diameters downwind spacing and 5 rotor diameters crosswind spacing) recovers of theoretical undisturbed wind energy yield, maximizing hydrogen production per installed megawatt.
Additional Institutional Findings & Environmental Social Governance (ESG) Standards:
- Biodiversity & Avian Protection: Wind installations in Rajasthan and Gujarat incorporate automated radar-assisted curtailment and ultrasonic deterrents to protect migratory bird flyways, including the Great Indian Bustard (GIB).
- Life-Cycle Carbon Intensity (LCA): Under ISO 14067 methodology, Indian green hydrogen produced via captive solar-wind microgrids achieves an audited carbon intensity of , comfortably beating the European Union green taxonomy threshold of .
Methodology, Data Sources & Bibliographic References
This research paper was developed through financial modeling of renewable energy project cash flows, electrolyzer stack degradation curves, Levelized Cost of Energy (LCOE) sensitivity matrices, and primary interviews with executives at utility-scale renewable developers and port authorities.
Core Data Sources & Citations:
-
01
Ministry of New and Renewable Energy (MNRE) National Green Hydrogen Mission Strategic Roadmaps.
-
02
Solar Energy Corporation of India (SECI) Tariff Auction Database & BESS Tender Filings.
-
03
International Renewable Energy Agency (IRENA) — Green Hydrogen Cost Reduction & Technology Outlook.
-
04
International Energy Agency (IEA) — Global Hydrogen Review and World Energy Outlook (2024–2026).
-
05
European Commission Directorate-General for Taxation and Customs Union — CBAM Guidance Documents.
-
06
Central Electricity Authority (CEA) National Electricity Plan & Transmission Grid Expansion Studies.
-
07
Power Grid Corporation of India (PGCIL) Green Energy Corridors Project Feasibility Studies.
-
08
BloombergNEF (BNEF) Hydrogen Economy Outlook & Battery Price Surveys.
-
09
McKinsey & Company Global Energy Practice — Decarbonizing Heavy Industry with Green Hydrogen.
-
10
Goldman Sachs Global Clean Energy Research — Clean Hydrogen: The Next Multi-Trillion Dollar Energy Infrastructure.
-
11
NITI Aayog — Harnessing Green Hydrogen: Opportunities for Deep Decarbonization in India.
-
12
World Bank Energy Sector Management Assistance Program (ESMAP) — Green Ammonia Export Economics.
-
13
Journal of Cleaner Production — Techno-Economic Assessment of Utility-Scale Renewable Hydrogen Systems.
-
14
International Journal of Hydrogen Energy — Comparative Degradation Mechanisms in Alkaline vs PEM Stacks.
-
15
Applied Energy Journal — Levelized Cost of Storage in Multi-Gigawatt Solar-Wind Hybrid Microgrids.
-
16
Nature Energy — Global Supply Chains for Clean Hydrogen and Geopolitical Trade Reconfiguration.
-
17
Energy & Environmental Science — Catalyst Optimization and Precious Metal Thrifting in Water Electrolysis.
-
18
Indian Chemical Council Annual Disclosures on Industrial Hydrogen Consumption in Refining and Urea.
-
19
Port of Rotterdam & Port of Antwerp-Bruges — Green Hydrogen Import Infrastructure Master Plans.
-
20
Hydrogen Council — Hydrogen Insights: A Comprehensive Global Perspective on Hydrogen Projects and Investment.
-
21
US Department of Energy (DOE) — Hydrogen Shot: $1 for 1 Kilogram in 1 Decade Technical Pathways.
-
22
Oxford Institute for Energy Studies — The Role of Green Hydrogen in Global Trade and Geopolitical Security.
-
23
Asian Development Bank (ADB) — Financing Renewable Hydrogen Infrastructure in South and Southeast Asia.
-
24
Journal of Power Sources — Long-Term Degradation Kinetics of Lithium Iron Phosphate Grid Storage Systems.
-
25
Royal Society of Chemistry — Advanced Membranes and Catalytic Interfaces for Clean Water Splitting.
-
26
Energy Policy Journal — Regulatory Frameworks for Cross-Border Renewable Hydrogen Off-Take Agreements.
-
27
American Chemical Society (ACS) Energy Letters — High-Efficiency Solid Oxide Electrolysis Steam Integration.
-
28
World Energy Council — World Energy Trilemma Index: Balancing Energy Security, Equity, and Sustainability.
-
29
International Association of Ports and Harbors (IAPH) — Clean Marine Fuels and Green Ammonia Bunkering.
-
30
German Federal Ministry for Economic Affairs and Climate Action (BMWK) — H2Global Carbon Auction Mechanisms.
-
31
IEEE Transactions on Sustainable Energy — Dynamic Frequency Control in Renewable-Dominated High-Voltage Grids.
-
32
Chemical Engineering Journal — Large-Scale Haber-Bosch Green Ammonia Synthesis Dynamic Simulation.
-
33
Desalination Journal — Energy Consumption Benchmarks in Coastal SWRO Water Treatment.
-
34
Stanford Precourt Institute for Energy — Techno-Economic Constraints on Global Hydrogen Energy Transport.
-
35
MIT Energy Initiative — The Future of Energy Storage in Zero-Carbon Power Systems.
-
36
Journal of Industrial Ecology — Life Cycle Assessment of Green Hydrogen and Ammonia Supply Chains.
-
37
Energy Conversion and Management — Thermodynamic Modeling of High-Temperature Solid Oxide Electrolyzers Integrated with Industrial Waste Heat.
-
38
Renewable and Sustainable Energy Reviews — Offshore Wind Farm Wake Modeling and Micro-Siting Optimization in Emerging Markets.
-
39
International Energy Forum (IEF) — Hydrogen Market Architecture and Carbon Border Pricing Integration.
-
40
Indian Renewable Energy Development Agency (IREDA) — Financing Norms and Debt Covenants for Multi-Gigawatt Green Hydrogen Projects.
`;